Posted
on 2025-01-30, 09:07,
by bjorn,
under Uncategorized.
In one of my web server setups, I’m using Varnish as a reverse proxy in front of NGINX. The server hosts multiple web sites and CMSes, and I wanted to make the web server deliver a default robots.txt if the web site did not already provide one.
Varnish makes this pretty easy, by reviewing the response from each backend. If the backend says it hasn’t got a robots.txt file, Varnish will create one on the fly.
The subroutine vcl_backend_response will catch the backend’s response status. In case the HTTP response is 404, Varnish will set the (internal) status code to 700 and call the vcl_backend_error subroutine.
sub vcl_backend_response {
    if (bereq.url ~  "/robots\.txt" && beresp.status == 404) {
        return(error(700,"OK"));
    }
}
And then in vcl_backend_error the status code 700 is picked up, creating a text/plain response containing a generic robots.txt content. The status code is set back to 200 before serving the response to the client. Some instructions for letting clients and proxies cache the response are also provided. Finally, the object lifetime is set to 1 hour so that Varnish doesn’t need to ask the backend every time.
sub vcl_backend_error {
    if (beresp.status == 700) {
        set beresp.status = 200;
        unset beresp.http.set-cookie;
        set beresp.http.cache-control = "Public";
        set beresp.ttl = 1h;
        set beresp.uncacheable = false;
        set beresp.http.Content-Type = "text/plain; charset=utf-8";
        set beresp.body = {"User-agent: EvilUserAgent
Disallow: /

User-agent: *
Allow: /
"};
        return (deliver);
    }
}
The response content from a request for robots.txt on a web site where it would otherwise not exist now looks like this:
And these are the response headers, with some details redacted:
# GET -USed https://example.com/robots.txt
200 OK
Cache-Control: Public
Connection: close
Date: Thu, 30 Jan 2025 06:21:49 GMT
Via: 1.1 example.com (Varnish/7.6)
Accept-Ranges: bytes
Age: 1208
Server: Varnish
X-Cacheable: YES
X-Varnish: 360768 360674
The principle can of course be extended to any missing or failing backend content, e.g. for hiding detailed backend responses or branding error pages with a company logo.
Tags: comp, Varnish Comments Off on Replacing missing web site content with Varnish
Posted
on 2020-12-01, 09:37,
by bjorn,
under Uncategorized.
The Suricata IDS is an extremely nice piece of software with multiple deployment scenarios, including inline and with mirroring or taps. The process itself usually runs without any problems, but as with any setup with multiple moving parts there are things that can go wrong.
Monitoring and making sure the Suricata processes itself is easy enough. Systemd can make efforts to keep a process running, and tools like Monit can assist in difficult cases. If something goes really wrong there are many monitoring and alerting suites available, for instance Icinga and Naemon.
While the process itself may run as it’s supposed to, something may happen to its surrounding environment. Hence, what we need to monitor is “aliveness”, i.e. making sure Suricata receives and parses the information it should see. Just like a full functionality test of an email server requires sending an email and making sure it passes through the whole delivery chain, a proper approach to verify IDS functionality is to submit some identifiable traffic and check whether the IDS sees it – basically a heartbeat check. I’ve implemented this using a simple cron job and an accompanying Icinga2 check.
The cron job
The cron job runs every minute, using hping3 to craft an ICMP packet with a customized payload. While a regular ping packet (ICMP echo request) sent from a Linux system usually carries a payload of special characters and some number (!”#$%&‘()*+,-./01234567), the detection packet must have a different and identifiable payload.
In my case this cron job runs on an internal system pinging a host on the Internet. The probes can easily be set up the other way, from the outside to a host protected by the IDS.
The IDS detection rule
The IDS must be told how to detect the crafted payload ping packet. This rather simple rule defines that an ICMP echo request packet (code 0, type 8) containing the payload “heartbeat_ping” should trigger an alert:
alert icmp $HOME_NET any -> $EXTERNAL_NET any (msg:"PROTOCOL-ICMP Heartbeat ping"; icode:0; itype:8; content:"heartbeat_ping"; classtype:misc-activity;sid:5100000;rev:1;)
Whenever Suricata sees the customized ping, it logs an alert. Where it logs may differ between installations, but in this setup alerts are explicitly logged to /var/log/suricata/fast.log. Thus, every minute Suricata will add a log entry looking like this:
To detect the presence or absence of the heartbeat packets, a short shell script involving logtail is used. Logtail keeps track of how much of a file has already been read, and shows us only what has happened since. Logtail handles log rotation brilliantly so there’s no false positives during log cleanup.
The following scripts looks for and counts new occurrences of “PROTOCOL-ICMP Heartbeat ping“, which is what Suricata logs when observing the heartbeat packet. If there are no occurrences the script will exit with a status code Icinga considers critical, otherwise the script will exit normally.
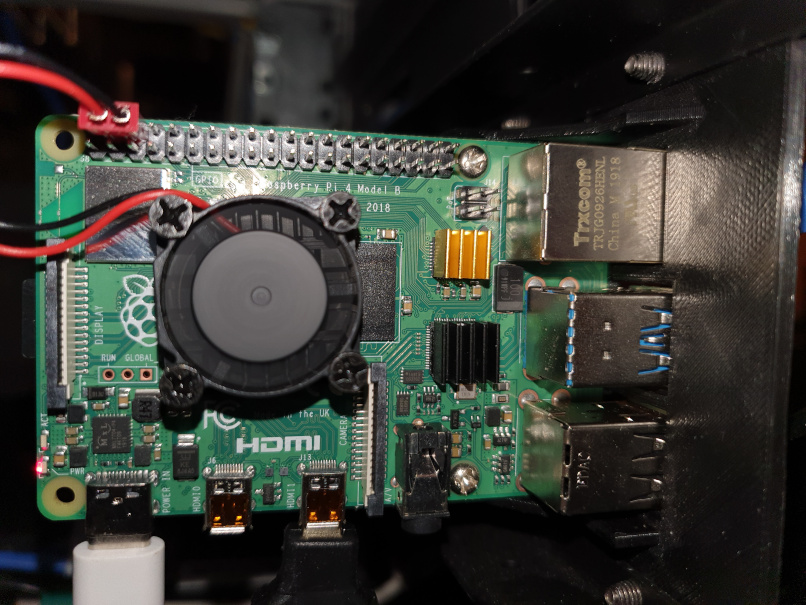
Suricata is running nicely on a Raspberry Pi 4, logging all events in JSON format to the default /var/log/suricata/eve.json file. The contents of the eve.json file will be continuously shipped to an Elasticsearch server for enrichment, analysis, and long-time storage.
Mounting log directories to tmpfs
The RPi boots from an SHDC memory card, but such cards wear out fast in I/O intensive settings. To help extend the memory card’s lifetime it’s a good practice to mount directories where there’s a lot of read and write activity away from the memory card. Options include mounting a remote file system and creating a RAM disk (tmpfs). There are many HOWTOs for managing that, but this article adds an analytic approach and explains how you can find out what will be effective in your setup.
On the IDS Raspberry Pi, I’ve mounted the whole /var/log directory structure (and a few others) to tmpfs: # grep log /etc/fstab tmpfs /var/log tmpfs rw,size=1G,nodiratime,noatime,mode=0755,uid=root,gid=root 0 0
To avoid filling the volume the logs are rotated frequently, with short or no retention. The important parts are, after all, shipped elsewhere for safe long term storage.
Building Filebeat for ARMhf
Elastic provides precompiled Filebeat packages for multiple platforms and architectures, but unfortunately not for the ARM architecture that Raspberry Pis are using. But that’s no problem, we’ll build our own! Filebeat is written in the Go Programming Language, in which I can cross compile to other platforms. How to do this is explained a few other places online, I’ve just automated the build process using Docker.
The following bash script runs on a different server. It uses a Golang Docker image to build the requested version of Filebeat, making the binary file available on a web site. The BEATSVERSION variable is updated when I need a specific version of Filebeat. The GOVERSION variable must be adjusted now and then; which version is currently used by Filebeat (and other beats) is mentioned in their release notes.
cd /var/www/html/filebeat-arm-bin
GOVERSION=1.13.10
BEATSVERSION=v7.10.0
docker run --rm -it -v pwd:/build golang:${GOVERSION} /bin/bash -c "go get -d -v github.com/elastic/beats; cd /go/src/github.com/elastic/beats/filebeat/; git checkout ${BEATSVERSION}; GOARCH=arm go build; cp filebeat /build/filebeat-${BEATSVERSION}"
echo "A new filebeat has been built"
Now I’ve got an ARMhf version of Filebeat. I’m installing it in /usr/local/bin/ on the RPi, with an appropriate systemd unit file. Note that there are some linebreaks that may not be shown clearly. # /etc/systemd/system/filebeat.service [Unit] Description=Filebeat sends log files to Logstash or directly to Elasticsearch. Documentation=https://www.elastic.co/products/beats/filebeat Wants=network-online.target After=network-online.target
Below are the relevant extracts from the filebeat.yml configuration file. Note that SSL/TLS configuration is not shown. --- name: sniffer filebeat.config.modules.path: ${path.config}/modules.d/*.yml setup.kibana.host: "https://siem.example.com:5601" setup.kibana.username: "kibana_username" setup.kibana.password: "kibana_password" output.elasticsearch.hosts: ["https://siem.example.com"] output.elasticsearch.username: "filebeat_username" output.elasticsearch.password: "filebeat_password" path.home: /usr/share/filebeat path.config: /etc/filebeat path.data: /var/lib/filebeat
To make the Filebeat setup mechanism work, I copied the /usr/share/filebeat/ and /etc/filebeat/modules.d/ directory structures from another server using a prepackaged Filebeat, same version. With those directories in place, it was time to let Filebeat do its magic. Confirm that the required module is available and then enable it:
Finally initiate the automated setup process, importing index templates, Kibana dashboards and everything else to the Elasticsearch server. Depending on your security permissions, the setup phase may require higher privileges than the regular Filebeat user.
# filebeat -c /etc/filebeat/filebeat.yml -e \ -E "output.elasticsearch.username=elastic" -E "output.elasticsearch.password=yourpass" Index setup finished. Loading dashboards (Kibana must be running and reachable) Loaded dashboards Loaded Ingest pipelines
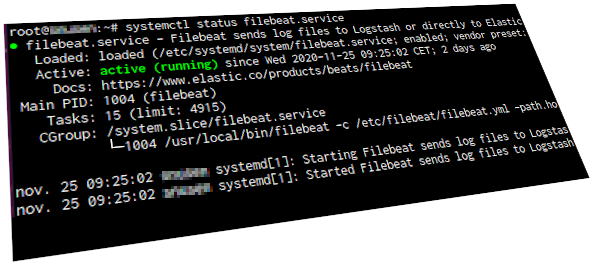
If all went well, start Filebeat and wait for the Suricata events to start rolling in!
Try convincing it not to ask for IP addresses eg with DHCP: # cat >/etc/systemd/network/10-dummy0.network [Match] Name=dummy0 [Link] Unmanaged=yes [Network] DHCP=no LinkLocalAddressing=no (I’m getting link-local addresses after all, though. But no harm done.)
Make sure systemd’s network config is enabled: # systemctl enable systemd-networkd.service
After a reboot to make sure all comes up as expected. The setup can be verified using the ip commands: # ip link show dev dummy0 3: dummy0: mtu 1500 qdisc noqueue state UNKNOWN mode DEFAULT group default qlen 1000 link/ether 8e:e4:15:40:2b:50 brd ff:ff:ff:ff:ff:ff # ip address show dev dummy0 3: dummy0: mtu 1500 qdisc noqueue state UNKNOWN group default qlen 1000 link/ether 8e:e4:15:40:2b:50 brd ff:ff:ff:ff:ff:ff inet 169.254.71.185/16 brd 169.254.255.255 scope global noprefixroute dummy0 valid_lft forever preferred_lft forever inet6 fe80::323d:d4f5:6a83:db31/64 scope link valid_lft forever preferred_lft forever
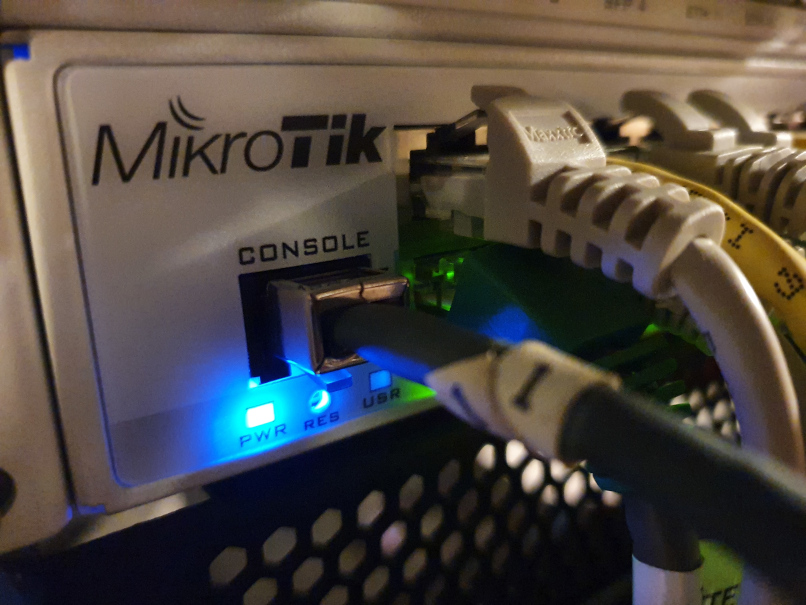
The rack mounted IDS sniffer.
Now that the virtual NIC for relaying the streamed traffic is enabled, make sure screen and tcpreplay are installed: # apt install -y tcpreplay screen
Set up a systemd unit file to start the relay: # cat > /etc/systemd/system/tzspstream.service [Unit] Description=TZSP stream Before=suricata.service After=systemd-network.service [Service] Type=oneshot RemainAfterExit=yes ExecStart=/usr/bin/screen -dm -S tzsp2pcap bash -c "/usr/local/sbin/tzsp2pcap -f | /usr/bin/tcpreplay --topspeed -i dummy0 -" [Install] WantedBy=multi-user.target
The above systemd unit starts a named screen, in which it starts tzsp2pcap feeding its output into tcpreplay which again dumps everything as fast as it possibly can into the dummy0 interface.
After starting the traffic sniffer on the MikroTik unit, streaming the captures to the RPi’s IP address, the captured traffic can be read from the dummy0 interface. This can be verified with e.g. tcpdump.
If you want a recent version of Suricata, the Raspberry Pi OS repos will not suffice. At the time of writing, precompiled Suricata packages for the ARM architecture exist only up to version 4.1, while the current version is 6.0. Debian’s Backports repositories currently provide some 5.x versions for ARM, which may be used after installing some additional dependencies. Peter Manev of the OISF team, however, maintains a Ubuntu PPA providing the most recent versions. While the PPA does not provide ARM packages, the source code with Debian build instructions is included so we can roll our own!
The rack mounted IDS sniffer.
Start by adding the PPA. On Ubuntu distributions one can use the apt-add-repository tool, on Debian not so much so we’ll just do it manually. The Raspberry Pi OS version in use, Raspbian GNU/Linux 10 (buster), maps pretty well to Ubuntu’s 20.04 LTS “Focal” release so we’ll use that: # cat > /etc/apt/sources.list.d/suricata.list deb http://ppa.launchpad.net/oisf/suricata-stable/ubuntu focal main deb-src http://ppa.launchpad.net/oisf/suricata-stable/ubuntu focal main
Add the PPA’s public key: # gpg --keyserver pgpkeys.mit.edu --recv-key D7F87B2966EB736F # gpg --export --armor D7F87B2966EB736F | apt-key add -
Update the OS, make sure the standard Suricata package is not installed from the repos, add some required build tools, download the Suricata source from the PPA, and finally install the libraries and tools required to compile Suricata: # apt -y update # apt-mark hold suricata # apt -y install devscripts # apt -y source suricata # apt -y build-dep suricata
When the above set of commands have run, the apt source command will have created a new directory named suricata-$version, in the current case suricata-6.0.0. In this directory we find a new directory named debian, with a rules file telling how Debian based distributions should build the software. For building on Raspbian we need to make one small change to this file, namely add LDFLAGS="-latomic" to the configure stanza. By default it looks like this: CONFIGURE_ARGS = --prefix=/usr/ --sysconfdir=/etc/ --localstatedir=/var/ --enable-nfqueue \ --disable-gccmarch-native --enable-hiredis --enable-geoip \ --enable-gccprotect --enable-pie \ --enable-non-bundled-htp \ $(ENABLE_LUAJIT) \ $(ENABLE_LUA)
After making the required change it should look like this, modification in bold: CONFIGURE_ARGS = --prefix=/usr/ --sysconfdir=/etc/ --localstatedir=/var/ --enable-nfqueue \ --disable-gccmarch-native --enable-hiredis --enable-geoip \ --enable-gccprotect --enable-pie \ --enable-non-bundled-htp \ LDFLAGS="-latomic" \ $(ENABLE_LUAJIT) \ $(ENABLE_LUA)
After saving the file, make sure you’re back in the source code directory (suricata-$version) and then start building the package with Debian’s tools: ~/suricata-6.0.0# debuild -b -uc -us
The build process will run for some time – on my Raspberry Pi the build took 15-20 minutes or so – and when it’s done you will find the completed product in the parent directory – a .deb file to install. Actually there will be two .deb files, one of which is a debug version that can be safely ignored. Install the regular package using dpkg: # dpkg -i suricata_6.0.0-0ubuntu2_armhf.deb Selecting previously unselected package suricata. (Reading database ... 49265 files and directories currently installed.) Preparing to unpack suricata_6.0.0-0ubuntu2_armhf.deb ... Unpacking suricata (6.0.0-0ubuntu2) ... Setting up suricata (6.0.0-0ubuntu2) ... Processing triggers for systemd (241-7~deb10u4+rpi1) ...
The rack mounted IDS sniffer.
After having installed Suricata, configure it to listen on the correct interface. Additional configuration and rule activation/deactivation should be performed as usual – that’s out of scope for this blog post but I’ll note that the included tool suricata-update works perfectly fine for managing rules and updates on this platform as well.
Important note: When building from source, you will not receive regular updates from the PPA. You should keep an eye on release notes and security notes for the project, and build new versions when required.
The next article in this series is Filebeat on a Raspberry Pi, explaining how I’m using Filebeat to ship Suricata logs to an external Elasticsearch log server.
Posted
on 2020-11-19, 00:25,
by bjorn,
under Uncategorized.
Working from home encourages home office optimization. During the COVID-19 period, with way more video conferences than usual, certain improvements were found necessary.
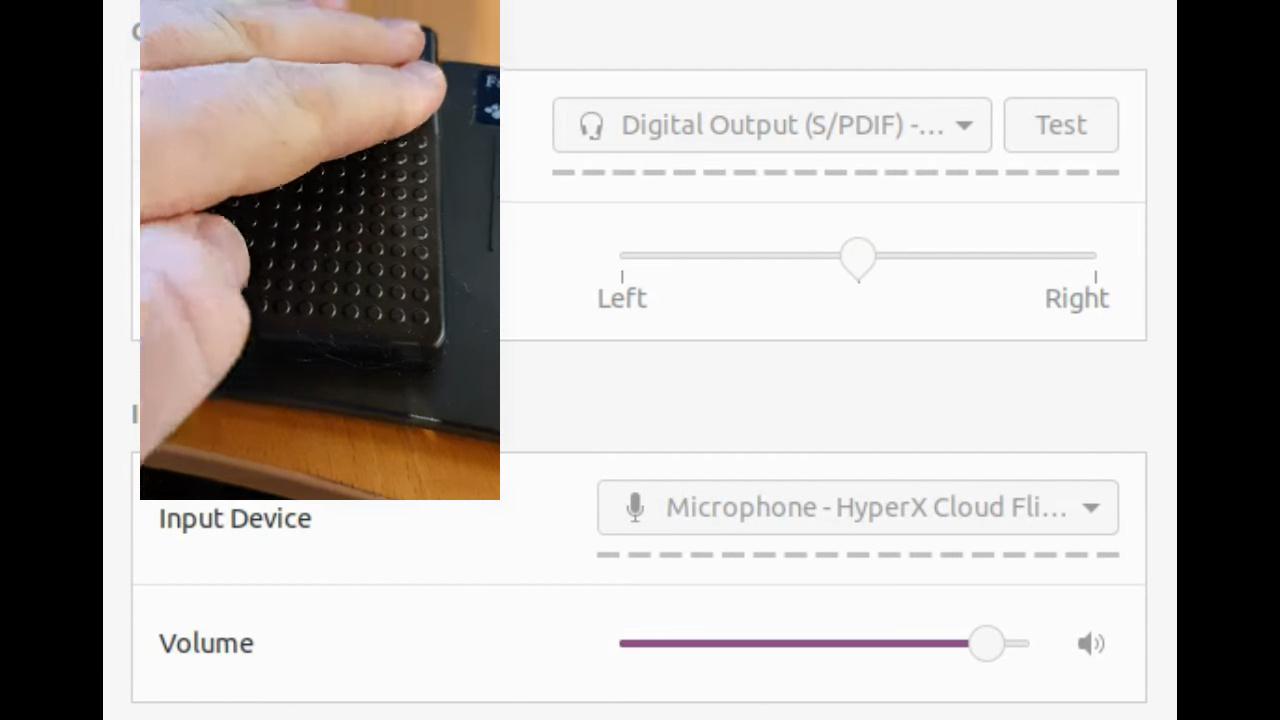
I guess everyone that’s been in a video meeting where more than one participant used a regular mic and regular speakers has experienced the wonders of audio feedback. That prompted me to acquire a comfortable gaming headset with a microphone, and I got myself a HyperX Cloud Flight wireless headset at a reasonable price.
I’m using GNOME on my Linux desktop. I find it quite efficient for my work, but the task of changing the sound output and input back and forth between my mic headset and the docking station’s line out and my web camera’s microphone requires just a bit too much point and click for one who prefers keyboard shortcuts for efficiency. To remedy this, I wrote a short bash script for toggling between the different audio components:
#!/bin/bash

# Note: Only two inputs to toggle between.
WEBCAMMIC="HP Webcam HD 4310 Analog Stereo"
HEADSETMIC="HyperX Cloud Flight Wireless Headset Mono"

# Note: Only two outputs to toggle between.
LINEOUT="USB Audio Line Out"
HEADSET="HyperX Cloud Flight Wireless Headset Digital Stereo"

# Change input
INPUTSOURCE=$(pacmd list-sources 2>&1 | egrep 'index:|device\.description' | \
	egrep -B1 "($WEBCAMMIC|$HEADSETMIC)" | \
	grep '  index:' | \
	awk '{print $NF}' | \
	sed "s/'//")
pacmd set-default-source $INPUTSOURCE

# Change output
OUTPUTSINK=$(pacmd list-sinks 2>&1 | egrep 'index:|device\.description' | \
	egrep -B1 "($LINEOUT|$HEADSET)" | \
	grep '  index:' | \
	awk '{print $NF}' | \
	sed "s/'//")
pacmd set-default-sink $OUTPUTSINK

pacmd list-sink-inputs | grep index: | awk '{print $NF}' | while read INPUT; do
  pacmd move-sink-input $INPUT $OUTPUTSINK
done
In the script I’ve predefined two input sources and two output sinks (that’s the PulseAudio nomenclature) I’m toggling between. For video conferencing I switch input and output to my headset, and when the meeting is over I switch back to listening to music through my docking station’s line out connected to a speaker/subwoofer setup.
The script works by grepping through the results from various uses of the pacmd command, a PulseAudio command line tool. The index of an active input source or output sink is prefixed with an asterisk, so the active component will show up as something like * index: 3 while the other will show up as for instance index: 7 (there are two leading spaces before “index”). For both the input and output, the script identifies the index of the two allowed components and then activates the inactive one.
Now that I had a command line script that toggles my headset in and out for video conferencing, I mapped it to the keyboard shortcut ctrl+F1. At this point, I no longer had to use the mouse to change the sound preferences. But wait, there’s more!
To make the toggling even easier (or lazier), I acquired a USB triple foot pedal from eBay. In Linux, such foot pedals identify as programmable USB keyboards. Subsequently I programmed one of the pedals to send the key combination ctrl+F1, which again triggered the audio toggling script.
And the remaining two pedals, you may ask? I mapped the second pedal to mute the microphone, and when pressing the third my Squeezebox player skips to the next song 🙂
Posted
on 2020-04-05, 08:55,
by bjorn,
under Uncategorized.
As always, scammers and phishers use newsworthy events to their advantage. The coronavirus pandemic is no exception. All over the worlds, security researchers observe phishing and scam attempts. Samples for studying and for awareness training are collected at various sites, including https://coronavirusphishing.com/.
A large number of security researchers have joined forces to establish a cyber threat intelligence site at https://www.cyberthreatcoalition.org/, providing free IT resources to combat cyber criminals seeking to exploit the COVID-19 situation. The site provides vetted and unvetted lists of IP addresses, domains, URLs and IOC hashes found in corona scams, both as downloadable text files and through Open Threat Exchange pulses.
If you’re already using OTX in your security infrastructure you might want to join the group through which you’ll get their pulses. If not, here’s a short bash script that creates a domain blacklist for use with the Postfix mail server. The script may be run in cron, but please be considerate and don’t run it too often.
You’ll also need a corresponding entry in your Postfix configuration. Add a check_sender_access check under smtpd_sender_restrictions, something like this:
Posted
on 2020-03-03, 22:12,
by bjorn,
under Uncategorized.
One of my honeypots runs INetSim which, among many other services, emulates an SMTP server. The honeypot is frequently used by spammers who think they’ve found a mail server with easily guessed usernames and passwords. Obviously I’m logging the intruders’ activities, so I’m shipping the logs to Elasticsearch using Filebeat.
Shipping the regular INetSim activity logs is easy, but extracting the SMTP headers from the mail server honeypot was more of a challenge. INetSim logs each mail’s full content (header and body) in a file, by default on a Debian based system this file is /var/lib/inetsim/smtp/smtp.mbox. Every mail has a header and a body. The start of a header block is indicated by a first line starting with “From”, and the header ends with an empty linefeed followed by the mail body. After the mail’s body there’s a new empty linefeed, separating that mail from the next.
Spam, spam, wonderful spam (Clip art courtesy of Clipart Library)
Extracting body content from an endless number of spam emails has limited value, but the headers are interesting. Information extracted from these can for instance be used to prime and improve spam filters as well as to identify and report compromised systems.
The following Filebeat multiline configuration extracts the interesting parts of each email:
What happens in this config section is that every block of text between empty linefeeds is concatenated into single lines. That leaves us with one long line for the header and one long line for the body for every logged email. Then, because of the include_lines stanza, the config only cares about the lines starting with From followed by an email address, shipping only those to the Logstash server configured to receive logs from the honeypot.
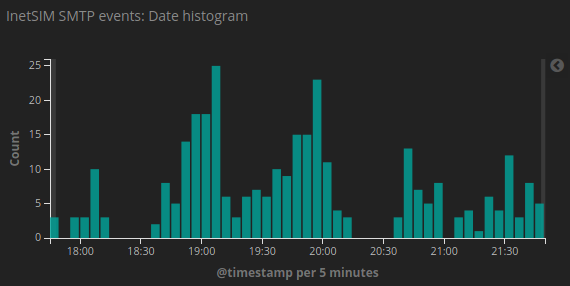
Spammer activity on a slow day.
On the Logstash side, I’m first extracting what was the first of the header lines, i.e. the From address and the email’s timestamp, then I’m storing the rest of the content in a variable named smtpheaders.
Then I’m parsing the email’s timestamp, using this as the authoritative timestamp for this event.
After some cleanup, the contents of the smtpheaders variable, converted by Filebeat into one single line with the linefeed character \n to separate each header line, are extracted using the key/value (kv) plugin. This plugin puts each whitelisted header into a nested field under the smtp parent field, i.e. the email’s subject header is stored in Elasticsearch as [smtp][subject]. When all headers are mapped, the smtpheaders variable is no longer useful so it’s deleted.
filter {
  # Extract the (fake) sender address, the timestamp,
  # and all the other headers
  grok {
    # Note two spaces in From line
    match => { "message" => [
      "^From %{EMAILADDRESS:smtp.mail_from}\s+%{MBOXTIMESTAMP:mboxtimestamp}\n%{GREEDYDATA:smtpheaders}",
      "^From %{USERNAME:smtp.mail_from}\s+%{MBOXTIMESTAMP:mboxtimestamp}\n%{GREEDYDATA:smtpheaders}",
      "^From %{GREEDYDATA:smtp.mail_from}\s+%{MBOXTIMESTAMP:mboxtimestamp}\n%{GREEDYDATA:smtpheaders}"
      ]
    }
    pattern_definitions => {
      "MBOXTIMESTAMP" => "%{DAY} %{MONTH} \s?%{MONTHDAY} %{TIME} %{YEAR}"
    }
    remove_field => [ "message" ]
  }
  # Extract the date from the email's header
  date {
    match => [ "mboxtimestamp",
               "EEE MMM dd HH:mm:ss yyyy",
               "EEE MMM  d HH:mm:ss yyyy" ]
  }
  # Replace indentation in Received: header and possibly others
  mutate {
    gsub => [ "smtpheaders", "\n(\t|\s+)", " " ]
  }
  # Map interesting header variables into an object named "smtp"
  kv {
    source => "smtpheaders"
    value_split => ':'
    field_split => '\n'
    target => "smtp"
    transform_key => "lowercase"
    trim_value => " "
    include_keys => [
      "content-language",
      "content-transfer-encoding",
      "content-type",
      "date",
      "envelope-to",
      "from",
      "mail_from",
      "message-id",
      "mime-version",
      "rcpt_to",
      "received",
      "return-path",
      "subject",
      "to",
      "user-agent",
      "x-inetsim-id",
      "x-mailer",
      "x-priority"
    ]
    remove_field => ["smtpheaders"]
  }
}
With the above configuration, INetSim provides a steady stream of events – one for every spam or phishing mail the intruders submit. Obviously the mail goes right into /dev/null so their efforts are completely wasted, while I’m getting nice Kibana dashboards telling how much spam my honeypot has caught (and deleted) today.
There’s one more thing, though. Each email usually has two From addresses; one often referred to as envelope-from (this is the first header line), and one called the header-from (the difference is explained here). While the envelope-from is a simple email address, the header-from can be almost anything including all kinds of international characters. Because an email header only allows a limited set of character, the header-from is often MIME encoded. For instance, an email from me would look like this:
From: Bjørn
But in the email header it would say:
From: =?UTF-8?Q?Bj=c3=b8rn?=
Since these headers aren’t decoded automatically, and since Logstash has no native decoding function for MIME, a small Logstash filter trick needs to be implemented. Logstash allows inline Ruby code, and the Ruby codebase provided with Logstash includes the mail gem, which in turn provides a MIME decode function. So I added the following to the Logstash filter:
The code first makes sure the mail gem is loaded, then it creates a new nested field [smtp][from_decoded] and inserts the value of [smtp][from] after applying Ruby’s Mail::Encodings.value_decode function. Equal decoding also happens on a few other headers, including the Subject header.
Some things are better left encoded.
With this in place, my honeypot Kibana dashboard displays all the headers properly, and I can read spam subjects like “Cîalis Professional 20ϻg 60 pȋlls” instead of wondering what “=?UTF-8?Q?C=C3=AEalis?= Professional =?UTF-8?Q?20=CF=BBg?= 60 =?UTF-8?Q?p?= =?UTF-8?Q?=C8=8Blls?=” really means.
Posted
on 2020-02-10, 10:13,
by bjorn,
under Uncategorized.
A customer of my employer Redpill Linpro was recently the target of a DDoS attack. While investigating the attack, we found a large number of HTTP requests with the User-Agent named CITRIXRECEIVER. The clients performed GET requests to multiple URLs on the customer’s web site at the rate of several thousand packets per second. The originating IP addresses were mostly Norwegian and even registered on major companies and organizations, but we also registered multiple requests from south-east Asian countries like Singapore, Thailand, and Vietnam.
At first we didn’t think those were a part of the ongoing DDoS attack, but the frequencies and rates were alarming. The fact that they seemed to hammer the same set of URLs over and over again was also somewhat concerning, since we’ve previously experienced similar scripted attacks from botnets of hijacked browsers running in zombie mode without the computer owner’s knowledge.
Tracking down and analyzing the requests we found that this was probably just something as simple as misconfigured Citrix clients, set to poll a defined beacon as described here. When contacting the owner of one of the more aggressive IP ranges, they confirmed that the URL of the customer’s website had indeed been configured as an “am I alive or not” connectivity check for no less than 25 000 (!) client systems, which absolutely explained the insane polling rate. Those 25 000 clients were associated with a single company – additional requests poured in from other organizations as well.
However, the poll was designed to be HEAD requests which are supposed to be non-intrusive and harmless. So why did they come across as multi-URL GET requests, causing increased load on the customer’s systems?
The first part of the explanation is that Varnish, which is used extensively at the customer’s web site, will by default convert a HEAD request to a GET request before responding. In many cases this makes sense, while for plain polling purposes HEAD requests are often configured to shortcut the processing and return a simple response.
The second part has to do with Varnish’ advanced capacity of Edge Side Includes (ESI), which allows a mainly static web site to include one or more dynamic components. The customer’s front page URL includes certain uncacheable, per-visitor components, so when someone accesses the front page multiple dynamic components are processed and included before returning the content.
Since HEAD requests weren’t specifically cut short, the simple and theoretically harmless beacon polling from thousands of Citrix clients turned out to have quite some impact after all.
Posted
on 2019-03-08, 20:08,
by bjorn,
under Uncategorized.
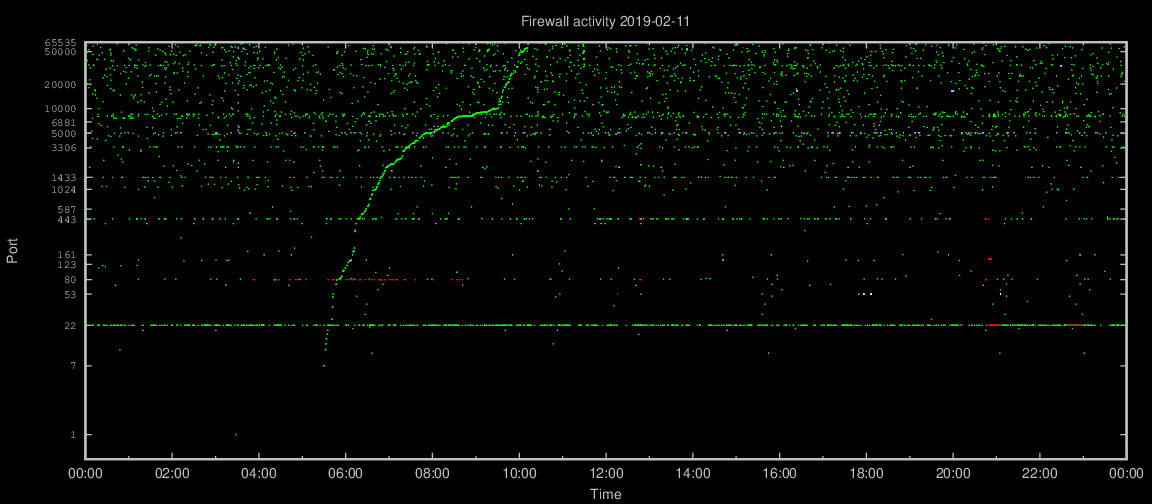
The other day while reviewing my fireplot graphs, I noticed (yet) another portscan. They’re not unusual. This one took around four and a half hour to complete, and covered a lot of TCP ports on one IPv4 address. That’s not unusual either. The curved graph shown below is caused by the plot’s logarithmic Y axis, where approximately linear activity will be presented as a curve. The scanning speed changed above TCP port 10000, when the scanner started increasing the interval between ports hence the “elbow” in the graph. Such behaviour is seen less often.
Port scans in general are mostly harmless and not worth pursuing, but I often check the source IP address anyway. What caught my attention this time was that each TCP port probe was performed from the same two IP addresses at the exact same time.
Now and again, more than one source IP address inevitably hits the same destination address at the same time. In this case, however, the two source IP addresses, from Verizon and China Telecom respectively, probed each and every destination port in the port scan simultaneously. The second source IP address usually did one additional probe after about a second before they both moved on to the next port. Here’s a short log extract:
As the log shows, the two source IP addresses, most likely unknowingly parts of a botnet, were working in perfect synchronization. The timing is too precise to be two individual scanning processes on opposite sides of the globe just started and left to run, so this scan was likely to have been under external control.