How to produce AfterGlow diagrams from Cowrie
I’ve been receiving a few questions on how to produce the AfterGlow diagrams from Cowrie logs, described in an earlier blog post. Instead of repeating myself through email requests, an explanation here will be better.
First of all, you will need to decide what you want to visualize. Showing the different attackers targeting a Cowrie honeypot has limited value (and can be visualized with something much simpler than AfterGlow). Showing the next steps of the intruders, however, is a job well suited for AfterGlow.
Based on the intruders’ behaviour in Cowrie, where a few intruders use a limited number of ports to try to connect to multiple target IPs, the CSV input to AfterGlow should reflect this, so we’ll need the following format:
source_IP,dest_port,dest_IP
Below is a Cowrie log line showing that the intruder from IP 5.45.87.184 attempts to contact the target IP 216.58.210.36 on port 443 (formatted for readability):
2017-01-16 15:32:30+0100 [SSHService ssh-connection on
HoneyPotSSHTransport,9704,5.45.87.184] direct-tcp connection
request to 216.58.210.36:443 from localhost:5556
To convert this into CSV that AfterGlow will accept, I wrote a short parser script. This can be done in most languages, I used Perl:
#!/usr/bin/perl

use strict;
use warnings;

while (<>) {
 if ($_ =~ /HoneyPotSSHTransport,\d+,(.*?)\].* to (.*?):(\d+) /) {
  print "$1,$3,$2\n"
 }
}
The Perl code was saved as /usr/local/bin/cowrie2csv.pl on the host running Cowrie.
Since I’m creating the graphs on a different server that where Cowrie is running, I wrote a bash wrapper to tie it all together. Note the quotes that separate what’s run locally and what’s run on the Cowrie server.
#!/bin/bash

MYDATE=$(date +%Y-%m-%d)
if [ "$1" = "yesterday" ]; then
 MYDATE=$(date +%Y-%m-%d -d yesterday)
fi

ssh honeypot "grep '${MYDATE}.*direct-tcp connection request' \
 /home/cowrie/log/cowrie.log* | \
 /usr/local/bin/cowrie2csv.pl" | \
 /usr/local/bin/afterglow.pl \
 -c /usr/local/etc/afterglow/color.properties | \
 /usr/bin/neato -T png > \
 /var/www/html/cowrie-afterglow-${MYDATE}.png
The color.properties file contains my AfterGlow preferences for this kind of diagrams, and contains the following:
color.source="red"
color.edge="lightgrey"
color.event="lightblue"
color.target="yellow"

maxnodesize=1;
size.source=$sourceCount{$sourceName};
size.event=$eventCount{$eventName};
size.target=$targetCount{$targetName};
size=0.2
sum.source=0;
shape.target=triangle
Now everything can be added to Cron for continuously updated graphs. I’m running the bash script once an hour through the day, and then just after midnight with the “yesterday” argument so that yesterday’s graphs are completed. These are the contents of /etc/cron.d/cowrie-afterglow:
15  * * * * root /usr/local/bin/cowrie2afterglow.sh
10 00 * * * root /usr/local/bin/cowrie2afterglow.sh yesterday
Now, depending on the popularity of your honeypot, you may or may not get useful graphs. Below is a graph showing 24 hours of outbound connection attempts from my honeypot, in which case it could make sense to limit the input data.
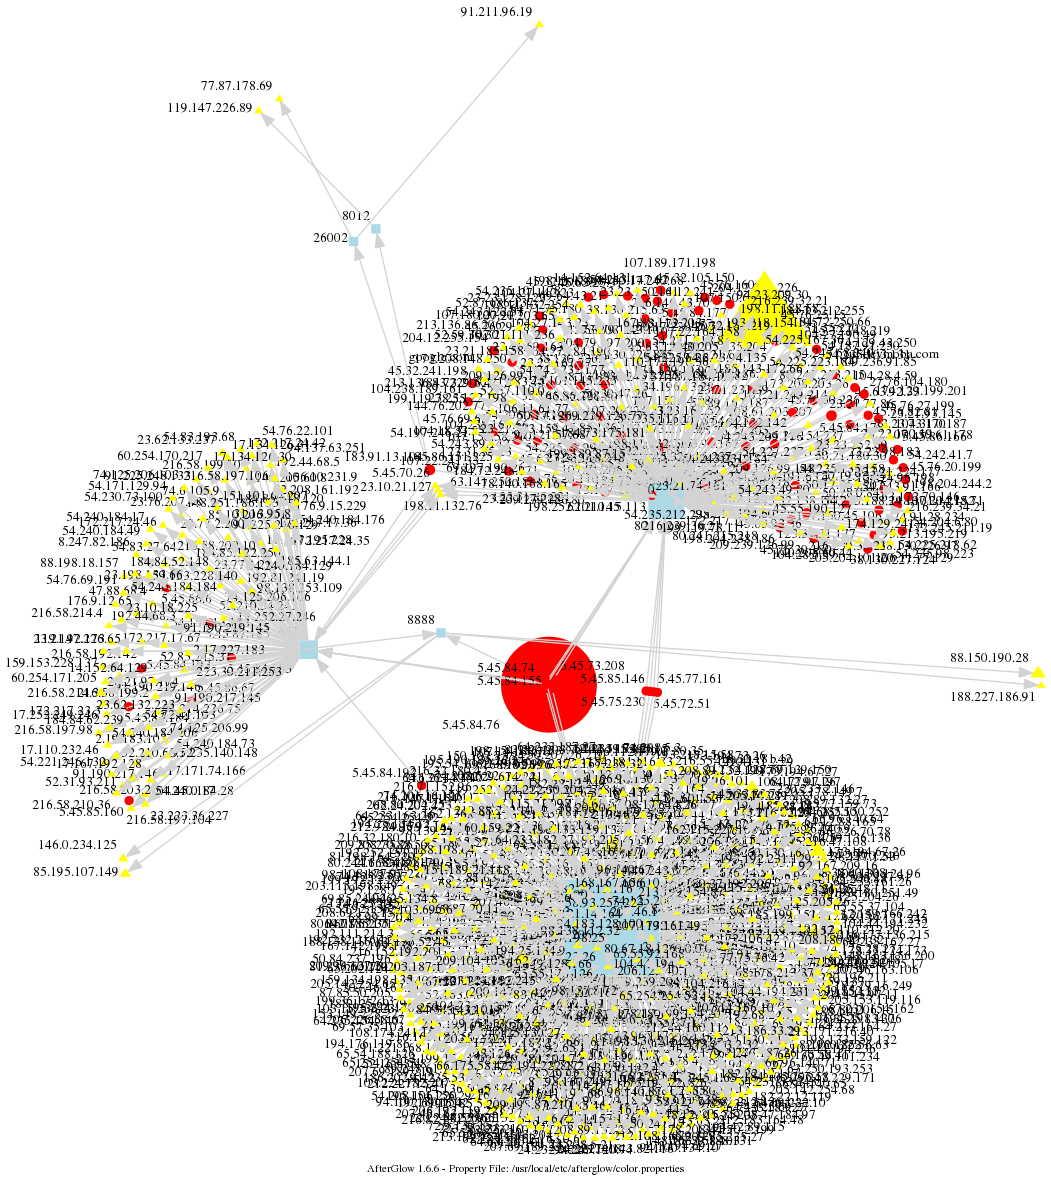
AfterGlow diagram of Cowrie outbound activity