Filebeat on a Raspberry Pi
I’ve recently revamped my home network security monitoring. Currently I’m capturing and streaming all network traffic on my MikroTik router’s outside interface to a remote sensor, namely a Raspberry Pi 4 with 4 GB RAM running Suricata IDS. Suricata’s log is read by Elastic’s Filebeat and shipped to an Elasticsearch instance, making the data available for further analysis with Kibana and its SIEM/security capabilities. This blog post is one of a series detailing the various components in this setup.
Other posts:
Suricata is running nicely on a Raspberry Pi 4, logging all events in JSON format to the default /var/log/suricata/eve.json file. The contents of the eve.json file will be continuously shipped to an Elasticsearch server for enrichment, analysis, and long-time storage.
Mounting log directories to tmpfs
The RPi boots from an SHDC memory card, but such cards wear out fast in I/O intensive settings. To help extend the memory card’s lifetime it’s a good practice to mount directories where there’s a lot of read and write activity away from the memory card. Options include mounting a remote file system and creating a RAM disk (tmpfs). There are many HOWTOs for managing that, but this article adds an analytic approach and explains how you can find out what will be effective in your setup.
On the IDS Raspberry Pi, I’ve mounted the whole /var/log directory structure (and a few others) to tmpfs:# grep log /etc/fstab
tmpfs /var/log tmpfs rw,size=1G,nodiratime,noatime,mode=0755,uid=root,gid=root 0 0
To avoid filling the volume the logs are rotated frequently, with short or no retention. The important parts are, after all, shipped elsewhere for safe long term storage.
Building Filebeat for ARMhf
Elastic provides precompiled Filebeat packages for multiple platforms and architectures, but unfortunately not for the ARM architecture that Raspberry Pis are using. But that’s no problem, we’ll build our own! Filebeat is written in the Go Programming Language, in which I can cross compile to other platforms. How to do this is explained a few other places online, I’ve just automated the build process using Docker.
The following bash script runs on a different server. It uses a Golang Docker image to build the requested version of Filebeat, making the binary file available on a web site. The BEATSVERSION variable is updated when I need a specific version of Filebeat. The GOVERSION variable must be adjusted now and then; which version is currently used by Filebeat (and other beats) is mentioned in their release notes.
cd /var/www/html/filebeat-arm-bin
GOVERSION=1.13.10
BEATSVERSION=v7.10.0
docker run --rm -it -v pwd:/build golang:${GOVERSION} /bin/bash -c "go get -d -v github.com/elastic/beats; cd /go/src/github.com/elastic/beats/filebeat/; git checkout ${BEATSVERSION}; GOARCH=arm go build; cp filebeat /build/filebeat-${BEATSVERSION}"
echo "A new filebeat has been built"
Now I’ve got an ARMhf version of Filebeat. I’m installing it in /usr/local/bin/ on the RPi, with an appropriate systemd unit file. Note that there are some linebreaks that may not be shown clearly.# /etc/systemd/system/filebeat.service
[Unit]
Description=Filebeat sends log files to Logstash or directly to Elasticsearch.
Documentation=https://www.elastic.co/products/beats/filebeat
Wants=network-online.target
After=network-online.target
[Service]
ExecStartPre=-/bin/mkdir -p /usr/share/filebeat \
/etc/filebeat /var/lib/filebeat \
/var/log/filebeat /usr/share/filebeat/module
ExecStart=/usr/local/bin/filebeat -c /etc/filebeat/filebeat.yml \
-path.home /usr/share/filebeat -path.config /etc/filebeat \
-path.data /var/lib/filebeat -path.logs /var/log/filebeat
Restart=always

[Install]
WantedBy=multi-user.target
Below are the relevant extracts from the filebeat.yml configuration file. Note that SSL/TLS configuration is not shown.---
name: sniffer
filebeat.config.modules.path: ${path.config}/modules.d/*.yml
setup.kibana.host: "https://siem.example.com:5601"
setup.kibana.username: "kibana_username"
setup.kibana.password: "kibana_password"
output.elasticsearch.hosts: ["https://siem.example.com"]
output.elasticsearch.username: "filebeat_username"
output.elasticsearch.password: "filebeat_password"
path.home: /usr/share/filebeat
path.config: /etc/filebeat
path.data: /var/lib/filebeat
To make the Filebeat setup mechanism work, I copied the /usr/share/filebeat/ and /etc/filebeat/modules.d/ directory structures from another server using a prepackaged Filebeat, same version. With those directories in place, it was time to let Filebeat do its magic. Confirm that the required module is available and then enable it:
# filebeat -c /etc/filebeat/filebeat.yml modules list
[...]
suricata
[...]
# filebeat -c /etc/filebeat/filebeat.yml modules enable suricata
Enabled suricata
Finally initiate the automated setup process, importing index templates, Kibana dashboards and everything else to the Elasticsearch server. Depending on your security permissions, the setup phase may require higher privileges than the regular Filebeat user.
# filebeat -c /etc/filebeat/filebeat.yml -e \
-E "output.elasticsearch.username=elastic"
-E "output.elasticsearch.password=yourpass"
Index setup finished.
Loading dashboards (Kibana must be running and reachable)
Loaded dashboards
Loaded Ingest pipelines
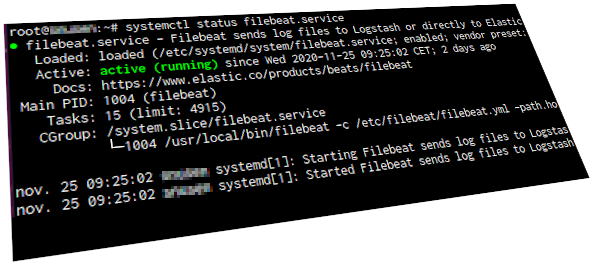
If all went well, start Filebeat and wait for the Suricata events to start rolling in!