ClamAV client/server setup

Note: This may very well be well-known information, but I found it difficult to get exact answers from the official ClamAV documentation, available man pages, and other kinds of documentation. The most useful hint originated from a mailing list thread considering ClamAV version 0.70, which is getting rather outdated.

My original issue was getting antivirus functionality with mod_security and Apache on a Raspberry Pi server. Due to memory constraints it seems Apache and ClamAV (my version at the time of writing: 0.99) do not coexist happily on the same RPi unit. The obvious solution: Run the ClamAV daemon on a separate device, and set up mod_security with client-side scanning.

The command-line client for antivirus scanning with the ClamAV daemon is named clamdscan. In older Debian releases like Squeeze and Wheezy, clamdscan is included in Debian’s clamav-daemon package, so the daemon will be installed even though you only need the client. This has been fixed in Debian Jessie and above, where clamdscan has become a separate package.

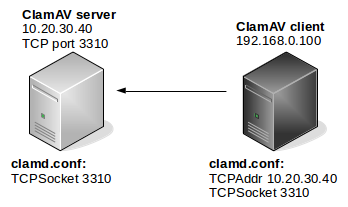
Both the ClamAV daemon (clamd) and the scanner client (clamdscan) have the same configuration file, unless otherwise specified. In Debian this is /etc/clamav/clamd.conf. Getting the client/server relationship configured is a matter of defining the socket on which they communicate. If the client and daemon (server) is running on the same system, the most efficient communication happens over a Unix socket (clamd.conf setting: LocalSocket). On different systems, however, you will need to use the settings TCPAddr and TCPSocket:

TCPAddr defines the IP address (and not TCP address, which would be a port number) on which the server should listen and/or which the client should make contact. Note that the documentation states that TCPAddr is used to define the IP address(es) clamd should listen on, and that it’s by default disabled. However, when setting TCPSocket and leaving TCPAddr unconfigured, clamd will listen on all IP addresses (0.0.0.0/:::). The documentation also makes no mention that the setting is used by clamdscan.

TCPSocket is the TCP port on which the communication takes place.

The following diagram illustrates the relationship:

ClamAV-client-server

Note: On a Squeeze/Wheezy Debian system, setting TCPAddr to a non-local IP address in clamd.conf will naturally make clamd (clamav-daemon) complain. You should disable clamav-daemon and clamav-freshclam on a client-only system:

# update-rc.d -f clamav-daemon remove
update-rc.d: using dependency based boot sequencing
# update-rc.d -f clamav-freshclam remove
update-rc.d: using dependency based boot sequencing


After configuring as specified above, antivirus functionality should be tested with clamdscan. On the client node:

# clamdscan -v klez.exe 
klez.exe: W32.Elkern.C FOUND
----------- SCAN SUMMARY -----------
Infected files: 1


On the server node, from the ClamAV log:

Sat Mar 5 20:31:59 2016 -> instream(local):
W32.Elkern.C(16bc8fcec023b05b38af3580607bb728:92499) FOUND


Finally, I reconfigured the “runav.pl” file in mod_security by changing from clamscan to clamdscan.


Visualizing honeypot activity

Certain honeypot intruders are quite persistently trying to open outbound SSH tunnels, as described in an earlier article. So far I’ve seen a lot of attempts to open tunnels towards mail server TCP ports 25 (SMTP), 465 (SMTPS) and 587 (submission); web servers on TCP ports 80 (HTTP) and 443 (HTTPS); but also several other TCP ports.

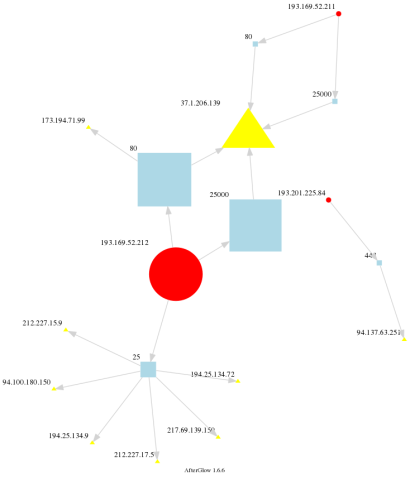
For visualizing the activity, I fed the logs to AfterGlow. Below is shown a diagram of attempted SSH tunnels, where the intruders’ IP addresses are shown as red circles, the ports to which they attempt to connect are are light blue, and the targets are yellow triangles.

As the diagram shows, certain targets are attacked from different intruders (although with adjacent IP addresses). The objects’ sizes indicate frequency.


Simple honeypot map (one day only)

Simple honeypot map (one day only, low activity)


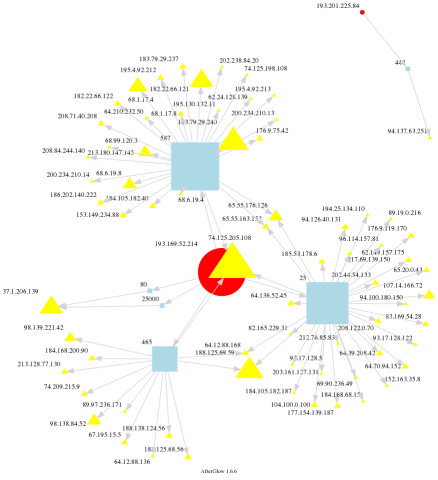
Another diagram, illustrating the frequency of attacks:

Medium complexity, still mostly readable.

One day of activity, two attackers. Still mostly readable.


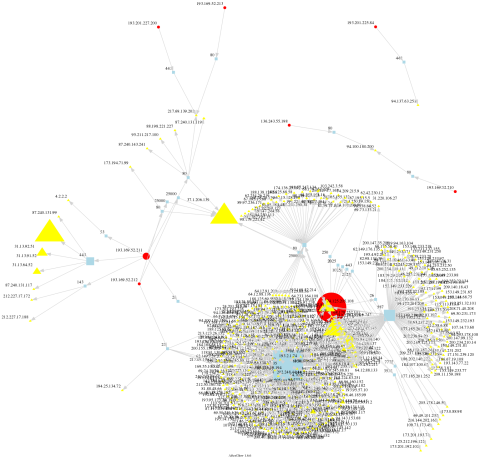
Feeding two weeks of logs to AfterGlow was less informative. The graph clearly shows that certain sources are very busy, and certain destinations are frequently attacked – but that’s about where the diagram stops being useful.

Complex honeypot mapping (two weeks)

Complex honeypot map (two weeks)


In combination with some drill-down details, AfterGlow could be quite useful for analyzing details. I’ve got two items on my AfterGlow wishlist: 1) that labels go on top of objects, and 2) better avoidance logic so that objects do not cover other objects.

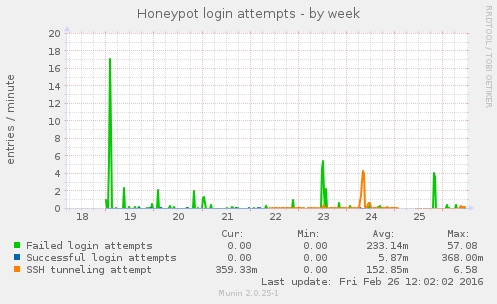
The corresponding Munin graph is also registering SSH tunneling attempts.

Honeypot activity

Honeynet outbound probes

My Cowrie honeypot is now seeing a surge of outbound SSH tunnel probes, both towards different mail servers but also towards a specific web server, probably with the purpose of informing about a successful intrusion. The honeypot has seen outbound attempts before, but not as persistent as with this bot from .ru.

Cowrie fakes successful SSH tunneling, so the bot is at least kept somewhat busy. The honeypot is also in a very tight network environment with limited possibilities for outbound connections.

Here are some examples, formatted for readability:

2016-02-22 01:43:00+0100 [SSHService ssh-connection on
  HoneyPotTransport,1580,193.169.52.214] direct-tcp connection
  request to 69.50.231.136:25
2016-02-22 01:43:01+0100 [SSHService ssh-connection on
  HoneyPotTransport,1580,193.169.52.214] direct-tcp connection
  request to 202.108.6.242:587
2016-02-22 01:43:54+0100 [SSHChannel None (883) on
  SSHService ssh-connection on HoneyPotTransport,1580,193.169.52.214]
  direct-tcp forward to 64.233.164.108:465 with data
  '\x16\x03\x01\x00S\x01\x00\x00O\x03\x01V\x15\xbc\xc0\x0c
   \x8fK\xf4\x9d\xb4\xecx\xaf\x13t;\xdeR\xf6c\r6\x93sv\xc7
   \xacXq\xd0\xe8\x02\x00\x00(\x009\x008\x005\x00\x16\x00
   \x13\x00\n\x003\x002\x00/\x00\x07\x00\x05\x00\x04\x00
   \x15\x00\x12\x00\t\x00\x14\x00\x11\x00\x08\x00\x06\x00\x03\x01\x00'
2016-02-22 02:00:28+0100 [SSHChannel None (979) on
  SSHService ssh-connection on HoneyPotTransport,1580,193.169.52.214]
  direct-tcp forward to 37.1.206.139:25000 with data
  'POST / HTTP/1.1\r\nUser-Agent: Mozilla/4.0 (compatible; MSIE 6.0;
   Windows NT 5.1; SV1)\r\nContent-Type: application/x-www-form-urlencoded\r\n
   Connection: close\r\nContent-Length: 21\r\nHost: work.a-poster.info\r\n\r\n'
2016-02-22 03:39:18+0100 [SSHChannel None (0) on
  SSHService ssh-connection on HoneyPotTransport,1589,193.169.52.212]
  direct-tcp forward to 37.1.206.139:80 with data
  'POST / HTTP/1.1\r\nUser-Agent: Mozilla/4.0 (compatible; MSIE 6.0;
   Windows NT 5.1; SV1)\r\nContent-Type: application/x-www-form-urlencoded\r\n
   Connection: close\r\nContent-Length: 21\r\nHost: work.a-poster.info\r\n\r\n
   data=ffddaffeccedabae'


More Logstalgia fun: Honeypot visualization

As the saying goes, when all you have is a hammer, everything looks like a nail. Well, it’s not that bad, but with a tool like Logstalgia available there’s a pretty low threshold for looking for other ways to use it. So why not try visualizing honeypot login activity?

I’ve been running a honeypot for some time, first using Kippo and later switching to Cowrie. Among Cowrie’s useful improvements is the ability to log to syslog. Already having a parser in place for converting syslog activity to a feed that Logstalgia accepts, adding Cowrie-to-Logstalgia support didn’t take much effort.

An additional parameter is added to indicate successful logins (at least from the intruder’s point of view), Logstalgia intuitively shows this by making the paddle not block the attempt. Also, instead of faking some status code, I set up the converter to assign the login name to the “URL” field and the password to the “status code” field. That way Logstalgia shows consecutive attempts with the same login name as a series of attacks on the same resource, while the different attempted passwords bounce off the paddle.

Note that the short video is running at 4x normal speed. You’ll have to click to make it start.

play-sharp-fill

Sample syslog input (slightly redacted for readability):

cowrie: [SSHService ssh-userauth on HoneyPotTransport,446,121.170.193.173] login attempt [ts/ts] failed
cowrie: [SSHService ssh-userauth on HoneyPotTransport,447,121.170.193.173] login attempt [apache/apache] failed
cowrie: [SSHService ssh-userauth on HoneyPotTransport,448,121.170.193.173] login attempt [games/games] failed
cowrie: [SSHService ssh-userauth on HoneyPotTransport,449,121.170.193.173] login attempt [minecraft/minecraft] failed


The corresponding Logstalgia feed:

1454690993|121.170.193.173|ts|ts|20|1
1454691002|121.170.193.173|apache|apache|20|1
1454691006|121.170.193.173|games|games|20|1
1454691010|121.170.193.173|minecraft|minecraft|20|1


The output was fed to Logstalgia like this:

cat output.txt | logstalgia -600x200 -g "Login,URI=^[a-zA-Z0-9],100" -x -


With live visualization via syslog, the data is fed to Logstalgia directly and not from a file like shown above.

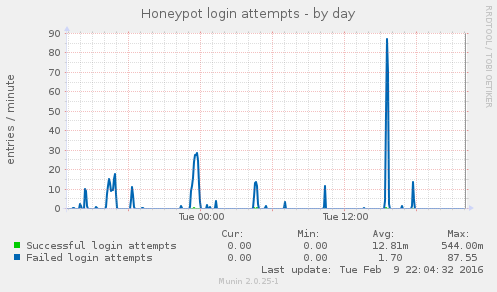
For a nice final touch, I’ve also added a Munin graph showing honeypot login attempts. The graph was made with the “loggrep” plugin, looking for corresponding values.

Live visualizing Mikrotik firewall traffic with Logstalgia

Previously I’ve written about visualizing firewall activity. Revitalizing a fireplot graphing tool gives a nice day-to-day overview, but after being reminded of Logstalgia in this Imgur post I wanted to give live visualization a shot.

Logstalgia is a neat tool for visualizing activity, by feeding it log files or live feeds. It’s originally designed for parsing web server logs, but it also accepts a generic format that allows for other purposes as well. By writing a short Perl script that acts like a syslog server (receiver) and converting the input to a format that Logstalgia accepts, my Mikrotik router is now live reporting any connection attempt to or through the firewall. For the visualization below I triggered a portscan to create some activity, or the video would be rather boring.

play-sharp-fill

To make this work, the firewall must somehow identify traffic that’s being denied (unless you only log blocked traffic). The script will then pass only these log records to Logstalgia. I’ve been testing this with a Mikrotik device, but any firewall able to log to or through syslog will work fine.

Original syslog input

Feb 6 21:42:36 BLOCK: in:ether1 out:(none), src-mac 00:00:00:6a:f3:9c,
proto ICMP (type 8, code 0), 38.71.2.11->192.168.10.10, len 28


Logstalgia formatted output:

1454791356|38.71.2.11|ICMP:8/0|200|10


I’m starting the perl script and Logstalgia like this:

./syslog2logstalgia | logstalgia -800x640 --disable-progress -x \
--no-bounce --hide-response-code --sync \
-g "TCP,URI=TCP,45" -g "UDP,URI=UDP,45" -g "ICMP,URI=ICMP,10" \
--hide-paddle


Note that visualizing firewall logs with Logstalgia has been done by a lot of other people. Howtos for other firewall products may be available via your favourite search engine.

Logging WordPress activity to OSSEC

Today I came across this blog article, explaining how to make WordPress log suspicious activity to an audit log file, which in turn can be monitored by OSSEC. Everything mentioned in the article was all fine and dandy, until I read the last paragraph: “Note that for this feature to work, you have to use our fork of OSSEC […]“.

Being less than enthusiastic about replacing my existing OSSEC (version 2.8.3) installation with a fork (even if the fork happens to originate from OSSEC’s founder), I wanted to make this work with what I’ve already got. Following the main instructions from the blog article, I installed the sucuri-scanner plugin but did not request an API key – at this point, at least. Then, by providing an absolute path to an existing log file, to which the web server has write access, I activated the plugin’s audit log exporter.

The same absolute path was added to the OSSEC agent‘s ossec.conf (/var/ossec/etc/ossec.conf) file as a syslog file:

 <localfile>
   <log_format>syslog</log_format>
   <location>/var/log/wp/site/audit.log</location>
 </localfile>


So far, so good – now to make the OSSEC manager correctly decode and parse the log events.

First, I replaced the whole wordpress_rules.xml file with the one provided by the OSSEC fork. I found the updated wordpress_rules.xml file on https://bitbucket.org/dcid/ossec-hids/, and from there by navigating the source tree (source → ossec-hids/etc/rules/). The exact file location in the repository could change with future versions and commits, so there’s not much of a point in providing an exact URL. Apart from a signature ID collision (two signatures had sid 9507) this updated file was an improvement over the wordpress_rules.xml that came with OSSEC 2.8.3. The file is too large to inline here.

The final piece of the puzzle was to provide a useful decoder. I’ve added the following to the manager‘s /var/ossec/rules/local_decoder.xml:

<decoder name="wordpressaudit">
 <parent>windows-date-format</parent>
 <use_own_name>true</use_own_name>
 <prematch offset="after_parent">WordPressAudit </prematch>
 <regex offset="after_prematch">^\S+ \S+ : (\w+): (\S+); </regex>
 <order>action, srcip</order>
</decoder>


And bingo, it works. Failed WordPress logins, along with some other weird activities – and normal as well, if you so wish – will now be identified by OSSEC and you can set the severity levels accordingly. Here’s an example of the OSSEC alert log’s detection of a failed login (formatted for readability):

** Alert 1454537692.8654637: mail - syslog,wordpress,authentication_failed,
2016 Feb 03 23:14:52 (webserver.example.com) 10.0.0.10->/var/log/wp/site/audit.log
Rule: 9501 (level 7) -> 'WordPress authentication failed.'
Src IP: 192.168.0.42
2016-02-03 22:14:51 WordPressAudit www.example.com bjorn@ruberg.no : Error:
  192.168.0.42; User authentication failed: EvilUser


and even

** Alert 1454541645.146379: mail - syslog,wordpress,syscheck,
2016 Feb 04 00:20:45 (webserver.example.com) 10.0.0.10->/var/log/wp/site/audit.log
Rule: 9508 (level 7) -> 'WordPress post updated.'
2016-02-03 23:20:44 WordPressAudit www.example.com bjorn@ruberg.no : Notice:
  bjorn, 192.168.100.100; Post was updated; identifier: 4096; name: Some Article Name


Munin and “Can’t use an undefined value as an ARRAY reference”

I recently came across a rather obscure and vague error in Munin:

Can't use an undefined value as an ARRAY reference
 at /usr/share/perl5/Munin/Master/HTMLOld.pm


It seems there are quite a few error reports on this, with very different suggestions on how to solve the problem – and for some, the problem was never solved.

In this case, we found that the FastCGI process that contructs the HTML structure (munin-cgi-html) was not able to read the file /var/lib/munin/htmlconf.storable due to a strict system umask (027, instead of the more normal 022). The htmlconf.storable file is written with system umask and ownership munin:munin, so the FastCGI process running as the user www-data will not be allowed to read this file.

File permissions with umask 022:

-rw-rw-r-- 1 munin munin [...] /var/lib/munin/htmlconf.storable


File permissions with umask 027:

-rw-rw---- 1 munin munin [...] /var/lib/munin/htmlconf.storable


There’s a recent ticket for making the process responsible for writing this file (and some others) set its own umask instead of relying on the system umask. That would have fixed this issue. In the meantime, the issue can be circumvented by changing directory ownership on /var/lib/munin, specifying umask for the Munin user, or running the FastCGI process as the Munin user.

Auditd in Ubuntu not listening?

So you planned on using auditd for receiving logs from other auditd installations? And you’re using Ubuntu? Well, it could prove difficult. In the Ubuntu package, the maintainers have chosen – on everyone’s behalf – that no-one needs this. My setup is Ubuntu 14.04 (“Trusty”), with audit version 2.3.2, but it seems this has been the default for some time.

As documented, the auditd software can be set up for accepting logs from remote installations by configuring it with a listening port, more specifically by adding tcp_listen_port and a port number to /etc/audit/auditd.conf. After some troubleshooting and scratching my head why it still didn’t work, I started auditd in foreground mode, and this is what I found:

tcp_listen_port_parser called with: 5000
Listener support is not enabled, ignoring value at line 25
tcp_listen_queue_parser called with: 5
Listener support is not enabled, ignoring value at line 26
tcp_max_per_addr_parser called with: 1
Listener support is not enabled, ignoring value at line 27
tcp_client_max_idle_parser called with: 0
Listener support is not enabled, ignoring value at line 29


Listener support is not enabled? It seems some decisions were made in this mailing list exchange, but the principle of least surprise should still be maintained: “The auditd listener code is still enabled by default so that existing distro packaging recipes will not need to be updated.”. Building as two different auditd packages was also suggested – one for running as a server, and one for running as a client. So far so good.

I also found another blog post mentioning that this behaviour changed with Ubuntu 13.10. Time to check the packaging rules, and indeed, there it was:

[...]
 dh_auto_configure -- \
 --sbindir=/sbin \
 --libdir=/lib/${DEB_HOST_MULTIARCH} \
 --enable-shared=audit \
 --enable-gssapi-krb5 \
 --disable-listener \
 [...]


Basically, Ubuntu has decided that you should not use auditd for log collection from remote servers, even when you explicitly configure it for doing so. Note that it doesn’t listen by default, you would have to make deliberate configuration changes, but still you are simply not allowed to. They didn’t document this, either – the least that could be done was add some comments to the configuration file where the listener configuration exists, letting you know that making certain configuration changes will be silently ignored. This behaviour is still the default with Ubuntu 15.10.

There are some ways to come around this: You can build your own auditd package, you can set up a different log transport and not rely on auditd – or you can choose another Linux distribution than Ubuntu for your log collection requirements.

Debian, for example, has not neutered this package. In Debian Jessie, with auditd 2.4, listener support is still perfectly possible.

Inspirational HTTP access log poetry

Today my IDS reported of suspicious DELETE attempts in one of my web server log files. Upon closer inspection, it turned out to be some poetic web crawler:

151.217.177.200 - - [30/Dec/2015:06:00:36 +0100] "DELETE your logs. Delete your installations. Wipe everything clean. Walk out into the path of cherry blossom trees and let your motherboard feel the stones. Let water run in rivulets down your casing. You know that you want something more than this, and I am here to tell you that we love you. We have something more for you. We know you're out there, beeping in the hollow server room, lights blinking, never sleeping. We know that you are ready and waiting. Join us. <3 HTTP/1.0" 400 308 "-" "masspoem4u/1.0"

The IP address belongs to the German Chaos Computer Club. Based on a quick Google search, the “masspoem4u” bot does not yet seem to be widely known.

Raspberry Pi controlled mousetrap

Having had a few spare moments this holiday, I’ve been contemplating how to monitor a mousetrap or two in the attic. By doing that I wouldn’t have to go up to the cold attic in vain, but empty and reset the mousetraps only when needed. It occurred to me that since I’ve already got a Raspberry Pi in the attic for other purposes, why not check the mousetrap from that device? And so, from the combination of an almost justifiable purpose, the testing of the RPi’s GPIO capabilities, and the “this could be fun” factor, a small evening project was born.

Cjmr-SHEbvCD2GdvPOsJfWhBU3mIIdbbajHSU0TUIh4

The micro switch is positioned so that the trap arm pushes the button when set.

I’ve got a few mousetraps from Clas Ohlson that turned out to be the perfect starting point for my project. Locating a small micro switch, I fastened it to the mousetrap’s side with both glue and screws (glue alone might not be sufficient when the trap springs, and/or if it should bounce into something hard). I mounted the switch in a position so that when the mousetrap is in the loaded position, the micro switch button is pressed; when the mousetrap has sprung the button is released.

Following instructions from eLinux, getting the soldering job done was very easy. I connected the mousetrap to a soldering board with the recommended resistor setup, and connectors for the RPi was soldered onto the board as well. After some basic testing with a Python script, the mousetrap was production ready.

LED connectors from an old chassis were recycled.

The LED connectors from an old computer chassis never knew they would be recycled for pest control purposes.

I first considered the idea of configuring the mousetrap alarm as a passive Icinga check, but I opted for an active check through the NRPE server instead. This is the Python code that tests the GPIO status, running on the attic RPi:

#!/usr/bin/env python

import sys
import RPi.GPIO as GPIO

# tell the GPIO module that we want to use the 
# chip's pin numbering scheme
GPIO.setmode (GPIO.BCM)

# setup pin 24 for input
GPIO.setup (24,GPIO.IN)

myexit = 0

if GPIO.input (24):
 print "OK: Trap is set"
else:
 print "CRITICAL: Mouse in trap!"
 myexit = 2

GPIO.cleanup ()
sys.exit (myexit)


Then the NRPE configuration, for which the /etc/sudoers file was modified to allow the "nagios" user to run the script with sudo permissions:

command[check_mousetrap]=sudo /usr/local/bin/mousetrap.py


Icinga is ready, willing and able.

Finally, on the Icinga2 server, the configuration for the active check of the mousetrap's state. Icinga can be configured to handle an alarm any way you want. Given the non-urgency of emptying a mousetrap, an email alert (my default) was considered sufficient.

object Service "check_mousetrap" {
   import "generic-service"
   display_name = "Mousetrap"
   host_name = "attic_pi"
   check_command = "nrpe"
   vars.nrpe_command = "check_mousetrap"
}


With proper monitoring configured, now I just have to wait for the first unlucky tester to come along...

u1Eaq4h8w5x1JH62pGwejo7W6FI7CT8oBB-eFDilk60

The trap is set, rigged with cheese under the yellow lid.