Raspberry Pi controlled mousetrap
Having had a few spare moments this holiday, I’ve been contemplating how to monitor a mousetrap or two in the attic. By doing that I wouldn’t have to go up to the cold attic in vain, but empty and reset the mousetraps only when needed. It occurred to me that since I’ve already got a Raspberry Pi in the attic for other purposes, why not check the mousetrap from that device? And so, from the combination of an almost justifiable purpose, the testing of the RPi’s GPIO capabilities, and the “this could be fun” factor, a small evening project was born.
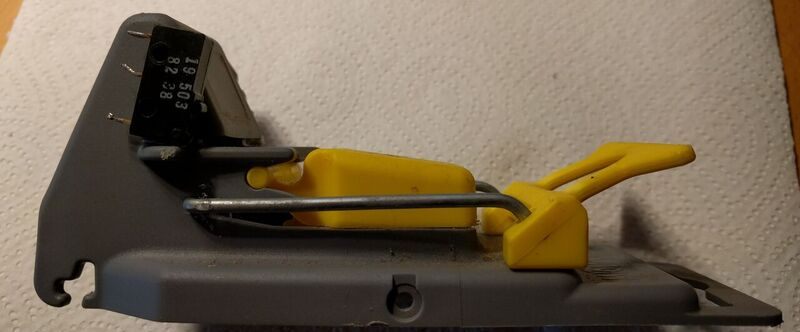
The micro switch is positioned so that the trap arm pushes the button when set.
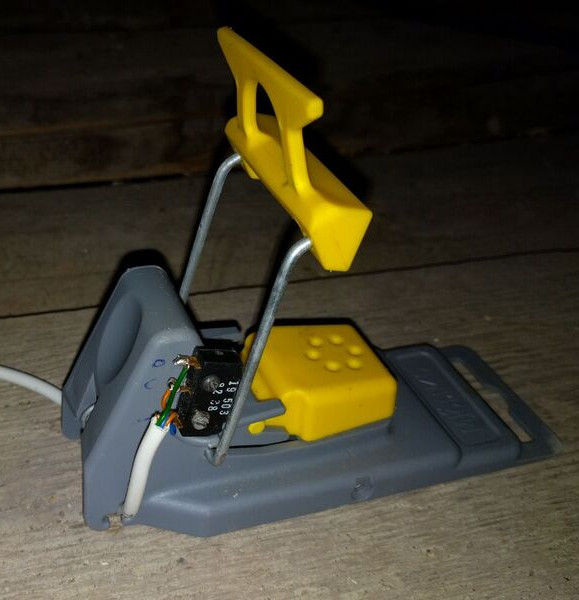
I’ve got a few mousetraps from Clas Ohlson that turned out to be the perfect starting point for my project. Locating a small micro switch, I fastened it to the mousetrap’s side with both glue and screws (glue alone might not be sufficient when the trap springs, and/or if it should bounce into something hard). I mounted the switch in a position so that when the mousetrap is in the loaded position, the micro switch button is pressed; when the mousetrap has sprung the button is released.
Following instructions from eLinux, getting the soldering job done was very easy. I connected the mousetrap to a soldering board with the recommended resistor setup, and connectors for the RPi was soldered onto the board as well. After some basic testing with a Python script, the mousetrap was production ready.
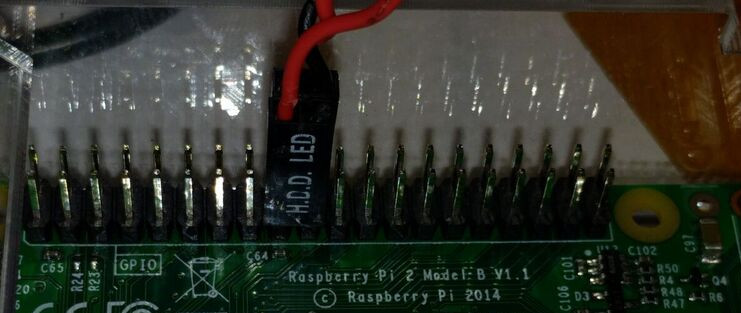
The LED connectors from an old computer chassis never knew they would be recycled for pest control purposes.
I first considered the idea of configuring the mousetrap alarm as a passive Icinga check, but I opted for an active check through the NRPE server instead. This is the Python code that tests the GPIO status, running on the attic RPi:
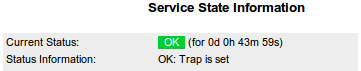
#!/usr/bin/env python

import sys
import RPi.GPIO as GPIO

# tell the GPIO module that we want to use the
# chip's pin numbering scheme
GPIO.setmode (GPIO.BCM)

# setup pin 24 for input
GPIO.setup (24,GPIO.IN)

myexit = 0

if GPIO.input (24):
 print "OK: Trap is set"
else:
 print "CRITICAL: Mouse in trap!"
 myexit = 2

GPIO.cleanup ()
sys.exit (myexit)
Then the NRPE configuration, for which the /etc/sudoers file was modified to allow the "nagios" user to run the script with sudo permissions:
command[check_mousetrap]=sudo /usr/local/bin/mousetrap.py
Icinga is ready, willing and able.
Finally, on the Icinga2 server, the configuration for the active check of the mousetrap's state. Icinga can be configured to handle an alarm any way you want. Given the non-urgency of emptying a mousetrap, an email alert (my default) was considered sufficient.
object Service "check_mousetrap" {
   import "generic-service"
   display_name = "Mousetrap"
   host_name = "attic_pi"
   check_command = "nrpe"
   vars.nrpe_command = "check_mousetrap"
}
With proper monitoring configured, now I just have to wait for the first unlucky tester to come along...
The trap is set, rigged with cheese under the yellow lid.