IDS with MikroTik and Snort

UPDATE: For more flexible streaming, and for not having to hack your Snort init scripts, you might want to consider this article as well. Now back to the scheduled program.

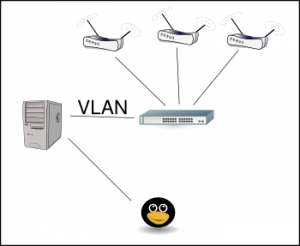
Port mirroring on a strategically positioned switch can be the best setup for an IDS sensor. If that’s not an option, RouterOS-based MikroTik devices support capturing network traffic, streaming it to a remote target using the TZSP protocol. This functionality is available in RouterOS and extended support is provided by the calea package.

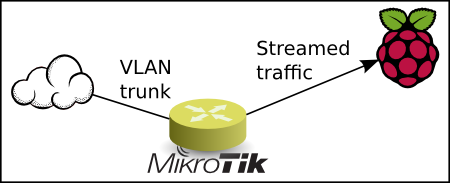
Configuring a remote IDS device with MikroTik has been described elsewhere, for instance here and here, but since my plan involved an ARM based Raspberry Pi, MikroTik’s trafr mentioned in those articles could not be used since it’s for x86 only and the source code does not seem to be available. Luckily I found tzsp2pcap which converts the TZSP stream from the MikroTik device into a pcap stream readable by Snort.

My setup

The setup used for this project consists of an RB2011UAS-RM (model is now EOL, replaced by RB2011UiAS-RM) acting as NAT firewall/router, and a Raspberry Pi B+ unit on which I installed Raspbian. The firewall connects to my ISP over a dedicated VLAN, so the outside interface with an official IP address is a bridge VLAN interface named bridge-vlan02-untagged. This will also be the capturing interface.

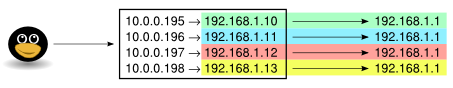
Note that the traffic capture takes place after NAT, so with this setup Snort will see traffic initiated from the inside as having the official IP address. In other words, you will not see the origin IP address of any suspicious outbound activity.

Compiling tzsp2pcap

Building tzsp2pcap requires the packages git, build-essential and libpcap0.8-dev. Now git clone or download the tzsp2pcap source code. To make tzsp2pcap compile on Raspbian I also had to modify the Makefile somewhat, from

cc -std=c99 -o $@ $(CFLAGS) $(LDFLAGS) -lpcap $<

to

cc -std=gnu99 -o $@ $(CFLAGS) $(LDFLAGS) -lpcap $<


After this modification, compile the code:

$ make
cc -std=gnu99 -o tzsp2pcap -Wall -Wextra -pedantic -O2 -lpcap tzsp2pcap.c
tzsp2pcap.c: In function ‘main’:
tzsp2pcap.c:355:12: warning: format ‘%lx’ expects argument of type ‘long unsigned int’, but argument 3 has type ‘int’ [-Wformat]
tzsp2pcap.c:355:12: warning: format ‘%lx’ expects argument of type ‘long unsigned int’, but argument 4 has type ‘int’ [-Wformat]

You should end up with a binary file named tzsp2pcap. Move it to /usr/local/sbin/ or similar.

IPv6 requirement

Note that tzsp2pcap seems to have been programmed to require IPv6 support even if IPv6 is not necessarily in use. If you get this message:

# tzsp2pcap
socket(): Address family not supported by protocol
Could not setup tzsp listener

…you’ll need to modprobe ipv6 or otherwise enable IPv6.

Verifying the capture

Now it’s time to test the reception of the traffic capture stream. First, start the tzsp2pcap listener, piping the result into tcpdump for making sense of it:

# tzsp2pcap -f | tcpdump -n -q -c 10 -r -

Then start the traffic capture on the MikroTik device. The IP address 10.20.30.40 is where you run tzsp2pcap.

/tool sniffer
set file-limit=0KiB filter-interface=bridge-vlan02-untagged memory-limit=0KiB streaming-enabled=yes streaming-server=10.20.30.40

In your tcpdump session, you should now see something like this:

IP [ip].49386 > 195.159.90.90.6697: tcp 51
IP 195.159.90.90.6697 > [ip].49386: tcp 85
IP [ip].49386 > 195.159.90.90.6697: tcp 0
IP [ip].4100 > 89.10.10.20.5060: UDP, length 419
IP 89.10.10.20.5060 > [ip].4100: UDP, length 547
IP 148.122.7.125 > 224.0.0.1: igmp
[...]

When started as shown above, tcpdump will stop by itself after having received 10 packets. If you see something similar to this, that means that both your MikroTik device and your tzsp2pcap listener are working correctly and you should give yourself a pat on the back!

Installing and testing Snort

Installing Snort is the easiest part: aptitude install snort. After answering the questions during the installation, allow Snort to start. Find out how the process is run:

# ps -ef | grep snort

You should see something like this:

snort 5628 1 1 12:22 ? 00:00:00 /usr/sbin/snort -m 027 -D -d -l /var/log/snort -u snort -g snort -c /etc/snort/snort.conf -S HOME_NET=[10.20.30.0/24] -i eth0

The above is required since we will not be running Snort in a normal fashion. Now stop Snort, and make sure it doesn’t start by itself at boot:

# update-rc.d -f snort remove

Based on the above findings and your own preferences, including what’s defined in snort.conf and any related config files, you should now be ready to forward the stream from the listener and into Snort. Note the ‘-r -‘ at the end, that’s what makes Snort analyze traffic received on STDIN.

# tzsp2pcap -f | snort -m 027 -d -u snort -g snort \
-c /etc/snort/snort.conf -r -

If everything runs as it should, you should start seeing some alerts trickling in. The default log file seems to be /var/log/snort/alert which is nice for debugging and testing. For those somewhat serious about running an IDS, storing alerts to a database will be the better approach.

Some sample output from /var/log/snort/alert:

[**] [1:553:7] POLICY FTP anonymous login attempt [**]
[Classification: Misc activity] [Priority: 3] 
03/14-15:11:12.287084 [ip]:43920 -> [ip]:21
TCP TTL:63 TOS:0x0 ID:0 IpLen:40 DgmLen:88
***AP*** Seq: 0xD87294F5  Ack: 0x7105DEA6  Win: 0xDA  TcpLen: 32
TCP Options (3) => NOP NOP TS: 313122335 3732452130

[**] [1:1321:8] BAD-TRAFFIC 0 ttl [**]
[Classification: Misc activity] [Priority: 3] 
03/14-15:54:18.504939 [ip] -> [ip]
IPV6-FRAG TTL:119 TOS:0x0 ID:625848831 IpLen:40 DgmLen:1096
Frag Offset: 0x016A   Frag Size: 0x0420
[Xref => http://www.isi.edu/in-notes/rfc1122.txt]

[**] [1:1417:9] SNMP request udp [**]
[Classification: Attempted Information Leak] [Priority: 2] 
03/14-16:08:20.293852 93.180.5.26:33306 -> [ip]:161
UDP TTL:245 TOS:0x0 ID:54321 IpLen:20 DgmLen:61
Len: 33
[Xref => http://cve.mitre.org/cgi-bin/cvename.cgi?name=2002-0013]
[Xref => http://cve.mitre.org/cgi-bin/cvename.cgi?name=2002-0012]
[Xref => http://www.securityfocus.com/bid/4132]
[Xref => http://www.securityfocus.com/bid/4089]
[Xref => http://www.securityfocus.com/bid/4088]

[**] [1:469:3] ICMP PING NMAP [**]
[Classification: Attempted Information Leak] [Priority: 2] 
03/14-16:52:10.022351 [ip] -> [ip]
ICMP TTL:37 TOS:0x0 ID:64264 IpLen:20 DgmLen:28
Type:8  Code:0  ID:46546   Seq:0  ECHO
[Xref => http://www.whitehats.com/info/IDS162]

[**] [1:524:8] BAD-TRAFFIC tcp port 0 traffic [**]
[Classification: Misc activity] [Priority: 3] 
03/14-17:15:57.591933 113.108.21.16:12209 -> [ip]:0
TCP TTL:50 TOS:0x0 ID:0 IpLen:20 DgmLen:40 DF
******S* Seq: 0x6F024630  Ack: 0x0  Win: 0x2000  TcpLen: 20


Maintaining and tuning Snort

Configuring, maintaining and tuning Snort further is a (large) job in itself, and should be customized according to your own requirements. See the excellent Snort documentation for more on this topic.

System loads

With a network usage at around 7-8 Mb/s, the RB2011 uses about 40-45% CPU with traffic capture enabled, as opposed to 10-15% without traffic capture.

The Raspberry Pi B+ running Snort uses almost no CPU in regular use, but about 90-100% CPU with a load average between 1 and 2 analyzing the network traffic during the download. For this purpose a Raspberry Pi 2 would probably be better suited.

UPDATE: A new test with other hardware shows the following loads:

With 7-8 Mb/s throughput, an RB450G performs at about the same load as the RB2011. Replacing the Snort sensor with a Raspberry Pi 2 shows quite an improvement: Where the regular RPi B+ spent all its CPU resources on traffic analysis (load values between 1 and 3), the RPi2 has a load of 10-15% (load values between 0.10 and 0.15).

Streaming from an underwater camera with a Raspberry Pi

kjaerra

Among this summer’s projects was getting an underwater camera online and streaming. The camera is placed within a fishing device designed like a cage, called Kjærra, dating back to the 14th century. The trap has a one-way entry; the fish enters the cage and can’t escape, and is subsequently extracted from the cage. When the trap is opened, the salmon (or trout) inside will be auctioned off to the spectators.

Underwater camera

Underwater camera

Starting with the camera itself, an underwater camera was acquired. The camera unit was secured between two pieces of wood, to make mounting easier and to prevent the camera from being destroyed or dismounted when the fish are extracted from the cage. The camera comes with a 20 meter cable which we led to a nearby dry location, where it’s powered from a battery and charger, providing a stable power source. The camera even has LEDs for night vision, but we’re not using it since it could confuse and scare the fish.

Finding underwater cameras that provide IP network video streams seemed quite impossible. This camera was no exception, providing only regular video signal (the good old yellow RCA plug). To convert the video signal into a computer readable format, we connected the very portable Vivotek VS8100 video server. Apart from the 12V power plug, the unit offers a video signal socket (BNC) and an RJ45 network socket. The unit could even be directly connected to the 12V power cable already provided with the camera.

Video server

Video server

The final piece was of course a Raspberry Pi mini computer, completing the chain by connecting it to the video server. Running the brilliant piece of software avconv, the Raspberry Pi pulls an RTSP video stream from the video server and converts it into an RMTP video stream which in turn is accepted by the streaming distribution server, an Adobe Flash Media Server 3.5. When we’re not streaming live, a short film with some useful information is shown instead.

When streaming live, what the camera sees may be viewed at Østlands-posten’s site. Østlands-posten is hosting the stream distribution; thanks a lot!

Also thanks to Magnus and Lasse at Arkena for hints and clues in this project.

This is the avconv command line, with any sensitive information redacted:

/usr/bin/avconv \
 -i rtsp://underwatercam:554/live.sdp \
 -f flv \
 -vcodec copy \
 -an \
 rtmp://fms-server/path?doPublish=MyPassword/streamName >/dev/null 2>&1

MikroTik configuration revision control with rancid

The config revision control tool rancid (Really Awesome New Cisco confIg Differ, but not at all limited to Cisco devices) has proven extremely useful. Rancid notifies you if there’s been some changes to a device, and since it’s Subversion backed it’s easy to extract full configurations in case you need it. Rancid has been supporting MikroTik devices for some time now.

Rancid exists in a lot of Linux repositories, or it could be installed from source – how to do that is documented elsewhere. After installing rancid, here’s what was needed for rancid to keep an eye on my MikroTik devices.

First I created a readonly user across all MikroTik units, intuitively named rancid. To mass create this account, I used dsh – described in an earlier article. Make sure your Linux system’s rancid user is able to log in to your devices using SSH keys and not passwords.

Next step is configuring rancid’s authentication file, ~/.cloginrc. Even though a password is required in the file, setting the identity will make rancid use key based SSH logins. Here’s my .cloginrc for reference:

add user * rancid
add password * SomeGarbledPasswordThatWon'tBeUsedAnyway
add method * ssh
add identity id_dsa

To verify that rancid may log in to the MikroTik devices, try a manual login as the rancid user:

~$ ~rancid/bin/mtlogin 10.10.0.1

You should be logged in to the device, and in the device’s log you should see

publickey accepted for user: rancid+ct

Now that the rancid user is able to log in to your units, it’s time to move on with configuring rancid. Most rancid.conf settings work out of the box, I only had to change these to convince rancid to use Debian’s standard svn repo directory. Make sure the “rancid” user or group has the necessary permissions to create a new repo. I also created a group called “devices”.

CVSROOT=/var/lib/svn/rancid; export CVSROOT
RCSSYS=svn; export RCSSYS
LIST_OF_GROUPS="devices"

After running rancid for the first time, a new repo has been created. Under ~rancid/var/ a “devices” directory has been created. In here you will find a file named “router.db”. Here you need to add your devices, like this:

10.10.0.1:mikrotik:up
10.10.0.2:mikrotik:up

When all this is in place, it’s time to allow rancid to run from cron.

Securely managing multiple Mikrotik units with dsh

dsh is a nice Unix/Linux tool for managing multiple systems efficiently, and I’m using it both at home and at work. In some distributions dsh has been replaced by pdsh, but no worries, pdsh is dsh compatible. Since all MikroTik devices running RouterOS might be managed over SSH, why not use dsh to manage these as well? Here’s a quick howto.

  1. Install ssh and dsh.
  2. If you don’t have one already, create an SSH DSA key pair:
    ssh-keygen -t dsa
    Do this with the Unix/Linux user account you’re managing the devices from. I strongly recommend securing the key pair with a password.
  3. Distribute the public part of the key pair (id_dsa.pub) to each MikroTik unit, using an existing account (e.g. admin). I used ncftpput for efficient distribution. The public key should now be visible in the “Files” folder on each MikroTik device.
  4. Now attach the public SSH key to a user account. I’ll use the admin account in this example. In cli, this is done with
    /user ssh-keys import public-key-file=id_dsa.pub user=admin
  5. Create a dsh group file, let’s call the group mikrotik (either /etc/dsh/group/mikrotik or ~/.dsh/group/mikrotik). Add the IP address or hostname of each MikroTik devices to this file, one unit per line. Specify the user name if required.

Sample group file:

admin@10.10.0.1
admin@10.10.0.2

You should confirm that SSH works fine with each device before expecting dsh to work. Example command:

~$ ssh admin@10.10.0.1

When this works fine, you’re now ready to mass manage your MikroTik devices. A few useful commands are shown below.

Check for and download the newest RouterOS version to all devices:

~$ dsh -g mikrotik '/system package update check-for-updates'
~$ dsh -g mikrotik '/system package update download'
~$ dsh -g mikrotik '/system package update print'

Change admin’s password (note that this will leave the new password in your user’s shell history):

~$ dsh -g mikrotik '/user set password=ThisIsTheNewPassword admin'

Check if any device needs a firmware upgrade:

~$ dsh -g mikrotik '/system routerboard print'

Add a new user:

~$ dsh -g mikrotik '/user add name=NewUser disabled=no group=full'

Språktest av 4 åringer

Når får vi obligatorisk språktest av journalister?

Using BOPM with InspIRCd

Using Blitzed Open Proxy Monitor (BOPM) with a fairly new version of InspIRCd needed a slightly different configuration than suggested here and there. The following is working for me, using InspIRCd 2.0.9 and the BOPM package provided by Ubuntu (Lucid, but shouldn’t make much of a difference).

First of all, the BOPM service wasn’t granted the proper user mode and consequently never registered the connect notifications. The InspIRCd documentation suggests that the proper modes might be set either in bopm.conf or InspIRCd’s configuration. BOPM’s documentation seems to suggest that the following is the correct config setting:

# bopm.conf
mode = "+c";

However, running BOPM in debug mode, it complained about mode c being unknown:

501 bopm c :is unknown mode char to me

This worked so much better:

# bopm.conf
mode = "+s +cC";

Now, BOPM will be notified upon every client connect, both local and remote. Next task is finding the proper regexp for detecting client connections. This is how a connect notification might look like:

*** CONNECT: Client connecting on port 6667 (class unnamed-26): ircnick!ircnick@server.example.com (192.168.200.103) [ircnick]

To catch the above notification, the following regular expression added to bopm.conf seems to work:

# bopm.conf
connregex = "\\*\\*\\* CONNECT: Client connecting on port [0-9]+.*?: ([^!]+)!([^@]+)@([^ ]+) \\(([0-9\\.]+)\\) \\[.*\\]";

Note: For some previous versions of InspIRCd, it seems the client IP is shown in brackets instead of parentheses. Also, it seems to not show the connection class. Obviously that will require a modified connregex.

For reference, this extract from inspircd.conf shows the necessary configuration on the InspIRCd side:

# inspircd.conf (or opers.conf)
<class name="BanOnly" commands="ZLINE" usermodes="s">
<type name="BOPM" classes="BanOnly" modes="+s +cC">
<oper name="bopm" password="bopmpass" host="*@localhost *@127.0.0.1" type="BOPM">

Reaching multiple instances of the same IP address

A friend recently presented me with the following challenge: Configure a system through which several appliances, all of them having an identical, non-routable, default IP configuration, can be reached simultaneously. All appliances are preconfigured with an IP address of 192.168.1.1 and they had no routing configuration enabled. Yet they should all be reachable over the Internet. The diagram below shows the basic infrastructure.

For the server (the nice grey cabinet to the left) to reach all those systems at the same time, a VLAN setup was required, so we set up a VLAN trunk to a nearby switch. Then the different appliances were connected to different un-tagged switch ports in dedicated VLANs – the first appliance was connected to a switch port in VLAN 10, the next to a switch port in VLAN 11, etc. Corresponding VLAN interfaces were configured on the server, and a local IP address was configured on each. To keep a minimum level of sanity, I configured the VLAN interface on vlan10 as 192.168.1.10, while vlan11 got 192.168.1.11, etc. To avoid too much confusion on the switch, I also set the MAC address on each VLAN interface to distinct values.

Next step was to configure correct IP routing using iproute2:
# VLAN 10
/sbin/ip link add link eth1 name eth1.10 type vlan id 10
/sbin/ip link set dev eth1.10 down
/sbin/ip link set dev eth1.10 address 00:04:de:ad:be:10
/sbin/ip link set dev eth1.10 up
/sbin/ip addr add local 192.168.1.10/24 brd 192.168.1.255 dev eth1.10
/sbin/ip route add 192.168.1.0/24 dev eth1.10 proto kernel scope link src 192.168.1.10 table 10
/sbin/ip rule add from 192.168.1.10 lookup 10 prio 1010
# VLAN 11
/sbin/ip link add link eth1 name eth1.11 type vlan id 11
/sbin/ip link set dev eth1.11 down
/sbin/ip link set dev eth1.11 address 00:04:de:ad:be:11
/sbin/ip link set dev eth1.11 up
/sbin/ip addr add local 192.168.1.11/24 brd 192.168.1.255 dev eth1.11
/sbin/ip route add 192.168.1.0/24 dev eth1.11 proto kernel scope link src 192.168.1.11 table 11
/sbin/ip rule add from 192.168.1.11 lookup 11 prio 1011

At this point I could reach the different appliances from the different source IPs:
# ping -I 192.168.1.10 192.168.1.1 -c1
PING 192.168.1.1 (192.168.1.1) from 192.168.1.10 : 56(84) bytes of data.
64 bytes from 192.168.1.1: icmp_seq=1 ttl=64 time=0.119 ms

Snooping with tcpdump on the different VLAN interfaces, also showing the MAC addresses, confirmed that the pings were reaching the correct appliance.

Then I set up corresponding IP addresses on the outside interface (eth0). The 10.0.0.195 address matches the device in VLAN 10, 10.0.0.196 matches VLAN 11 and so on. The outside IP addresses are official IP addresses, but I’ve changed them to protect the innocent.

/sbin/ip addr add local 10.0.0.195/24 dev eth0
/sbin/ip rule add to 10.0.0.195 fwmark 10 table 10
/sbin/ip rule add fwmark 10 lookup 10
/sbin/ip addr add local 10.0.0.196/24 dev eth0
/sbin/ip rule add to 10.0.0.196 fwmark 11 table 11
/sbin/ip rule add fwmark 11 lookup 11

To make sure the packets were being identified correctly all the way through, they were tagged upon reaching the outside interface, based on the IP on which they arrived.

So far so good, now it was time for iptables to show its powers:
# VLAN 10
/sbin/iptables -t mangle -A PREROUTING -i eth0 -d 10.0.0.195 -j MARK --set-mark 10
/sbin/iptables -t nat -A PREROUTING -i eth0 -d 10.0.0.195 -j DNAT --to-destination 192.168.1.1
/sbin/iptables -A FORWARD -m mark --mark 10 -j ACCEPT
/sbin/iptables -t nat -A POSTROUTING -m mark --mark 10 -j SNAT --to-source 192.168.1.10
# VLAN 11
/sbin/iptables -t mangle -A PREROUTING -i eth0 -d 10.0.0.196 -j MARK --set-mark 11
/sbin/iptables -t nat -A PREROUTING -i eth0 -d 10.0.0.196 -j DNAT --to-destination 192.168.1.1
/sbin/iptables -A FORWARD -m mark --mark 11 -j ACCEPT
/sbin/iptables -t nat -A POSTROUTING -m mark --mark 11 -j SNAT --to-source 192.168.1.11

The above commands maps the outside addresses on eth0 to the corresponding VLANs on the inside. Note that every incoming packet is destination NATed (DNAT) to 192.168.1.1 while they are being source NATed (SNAT) based on the VLAN to which they are mapped. As the appliances were not able to route traffic, all communication had to look like it happened on the local network only.

Now I expected to be able to access each appliance from the outside, but it turned out that only one appliance could be reached. tcpdumping on each VLAN interface confirmed that traffic from the outside reached each appliance, and the appliance responded, but the response never came all the way back. This was rather puzzling as nothing appeared in any log. However, my colleagues reminded me about rp_filter, which dropped weird traffic without logging anything. Thus, the key that unlocked everything was this:
echo 0 > /proc/sys/net/ipv4/conf/all/rp_filter
echo 0 > /proc/sys/net/ipv4/conf/eth1.10/rp_filter
echo 0 > /proc/sys/net/ipv4/conf/eth1.11/rp_filter

And voila – from the outside world, we were able to reach every single appliance on the inside, all with the same unroutable RFC1918 address.

Path MTU discovery ICMP messages

This is more for my own reference… After configuring my ADSL modem to run i bridge mode, it seems I’m running into a few path MTU issues. To identify any path MTU messages, I’ve been analyzing the traffic on the outside interface looking for path MTU issues using the following tcpdump syntax:

tcpdump -n -s0 -i ppp0 'icmp[icmptype] != icmp-echo and icmp[icmptype] != icmp-echoreply'

Update: Of course, this exact syntax is documented on tcpdump’s own site

Avoid hotlinking with Varnish

There’s a quite a few articles on how to configure Apache to avoid hotlinking, so that material on your web server isn’t used on remote sites (at least not without your knowing).

This is how to do the same with Varnish. The example suggests that you forbid hotlinking to anything under http://www.example.com/fun/. The code will of course need to be added to whatever else exists in vcl_recv.

sub vcl_recv {
  if (req.http.host == "www.example.com" &&
  req.url ~ "^/fun/" &&
  (req.http.referer && req.http.referer !~ "^http://www.example.com/")) {
    error 403 "No hotlinking please";
  }
}

Spanning-tree on Linksys srw2008

After finally admitting defeat I had to boot into Windows for managing my Linksys SRW2008 switch through its WebView, the reason being I could not find out how to enable regular spanning-tree on the switch.

Having enabled it through its IE-specific web UI, I logged in to the (rather poorly documented) CLI afterwards to check what had changed in the config. And the single, magic configuration line that enabled spanning-tree on the switch was this one:

spanning-tree

*sigh*